If you’ve ever wondered whether regular engagement on social media is really doing anything for your brand, look no further than the eliminated artists on NBC’s American Song Contest. While no longer competing for the crown, these artists are reaping the benefits of exposure and engagement.
A couple weeks ago we started tracking this competition in Airtable (more on the launch of this project here). But here’s the gist—we love identifying relationships within data and teaching people more about how to use our product. We figured, what better way to do this than with reality TV? And this show comes with predictable unpredictability and 56 hopefuls looking to launch their music careers.
Within the confines of the competition, the goal is to win. But for many artists, the real prize is getting discovered. Take Jennifer Hudson, who somehow only came in 7th place on season three of American Idol. (Honestly, this could be a whole blog of its own.)
We’ve been tapping into data like how social-media engagement translates to followers, and asking questions like “Does advancing forward in the competition correlate to more listeners on Spotify?” (Spoiler: the answer is—not necessarily).
How to build a base that tracks social growth
At the start of any project in Airtable you want to figure out what to track and which questions your data will answer. In this case we knew we wanted to track how each artist was performing across the season on social media and how each episode impacted follower growth.
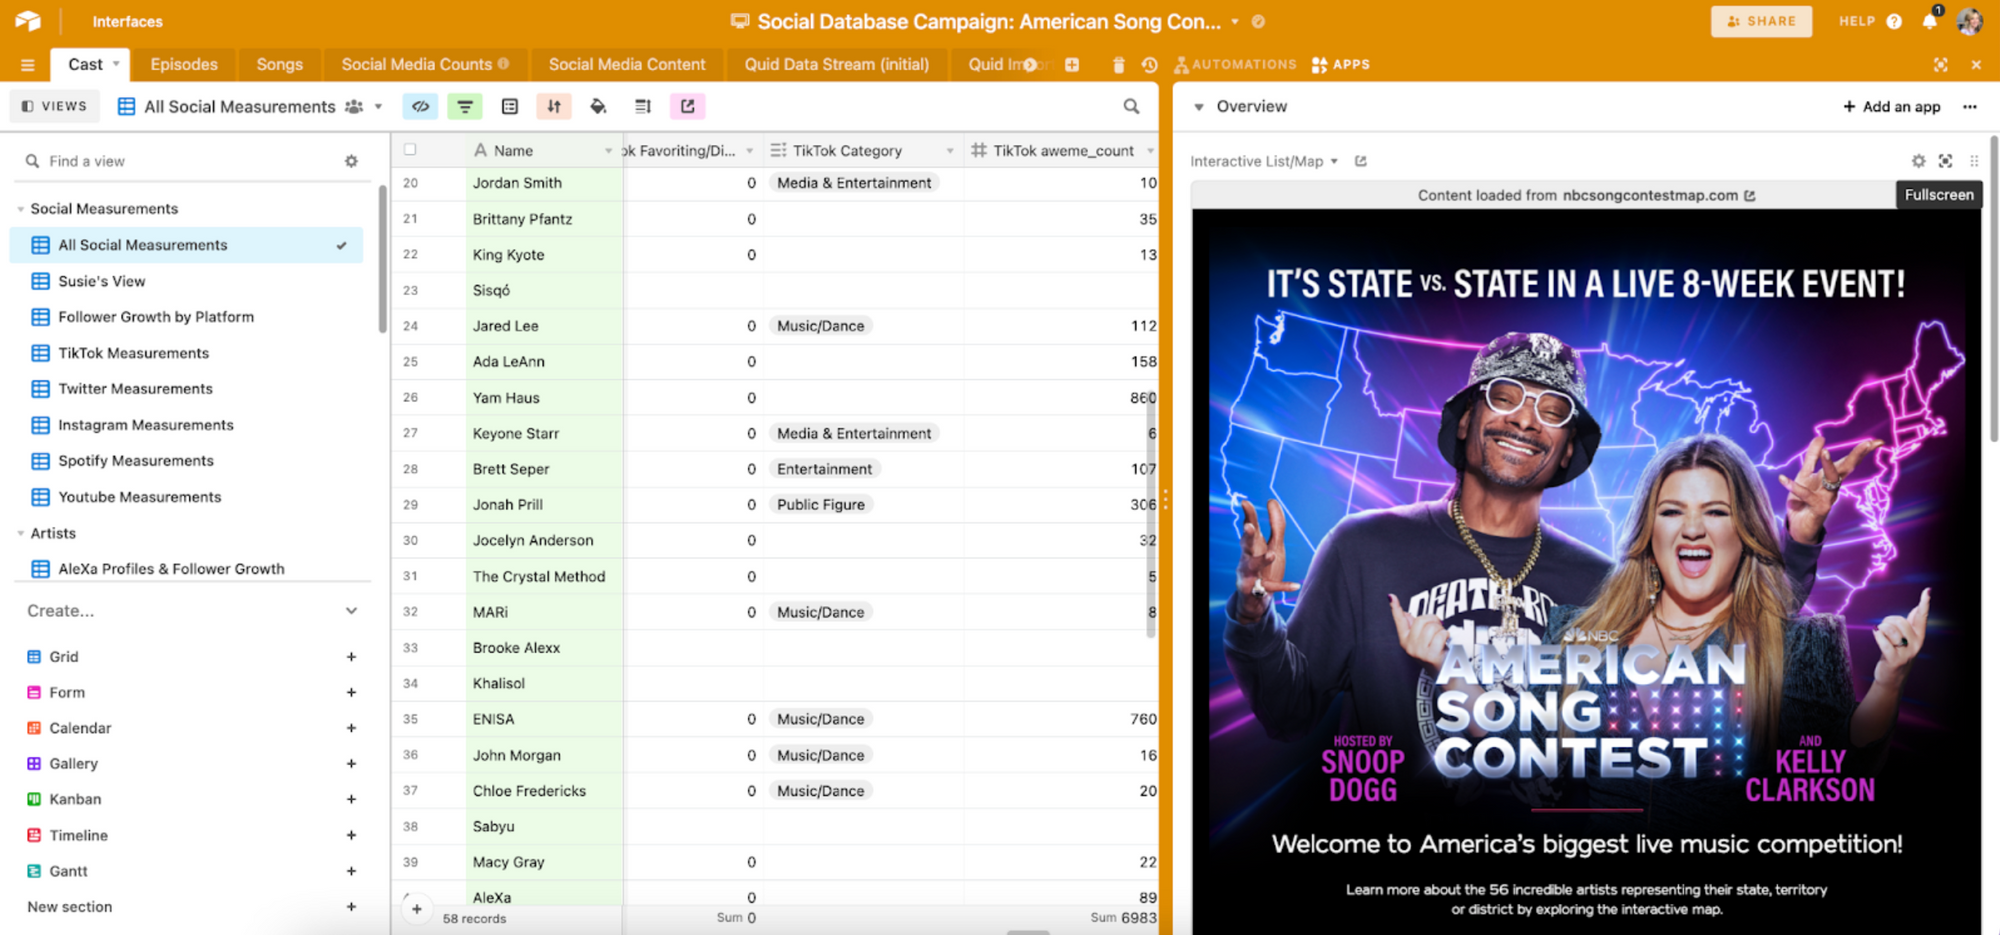
Before the show aired we needed a reliable list of contestants, their respective states, and their social media accounts. NBC has a pretty amazing interactive dashboard map for this.
With Airtable’s apps feature you can look at content from anywhere on the internet by embedding the URL directly into your dashboard. So we embedded NBC’s map into our base as an app and we were able to link out to each contestant's social platforms on Twitter, Instagram, Spotify, YouTube, and TikTok.
We paired our base with each artist’s Twitter, Instagram, Spotify, and YouTube accounts through API documents (links for these documents are below if you want to try this on your own).
An API is an application programming interface. In short, it’s how applications talk to each other. In this instance, we wanted Spotify to “talk” to Airtable—to tell us how many followers a particular artist has, then automatically update that follower count every twelve hours.
To connect these platforms, we found each artist's unique Spotify ID, which you can see below. (Think of it as a barcode for the artist, the individual code created for each unique user on the platform. You’ve likely seen them and not noticed.)
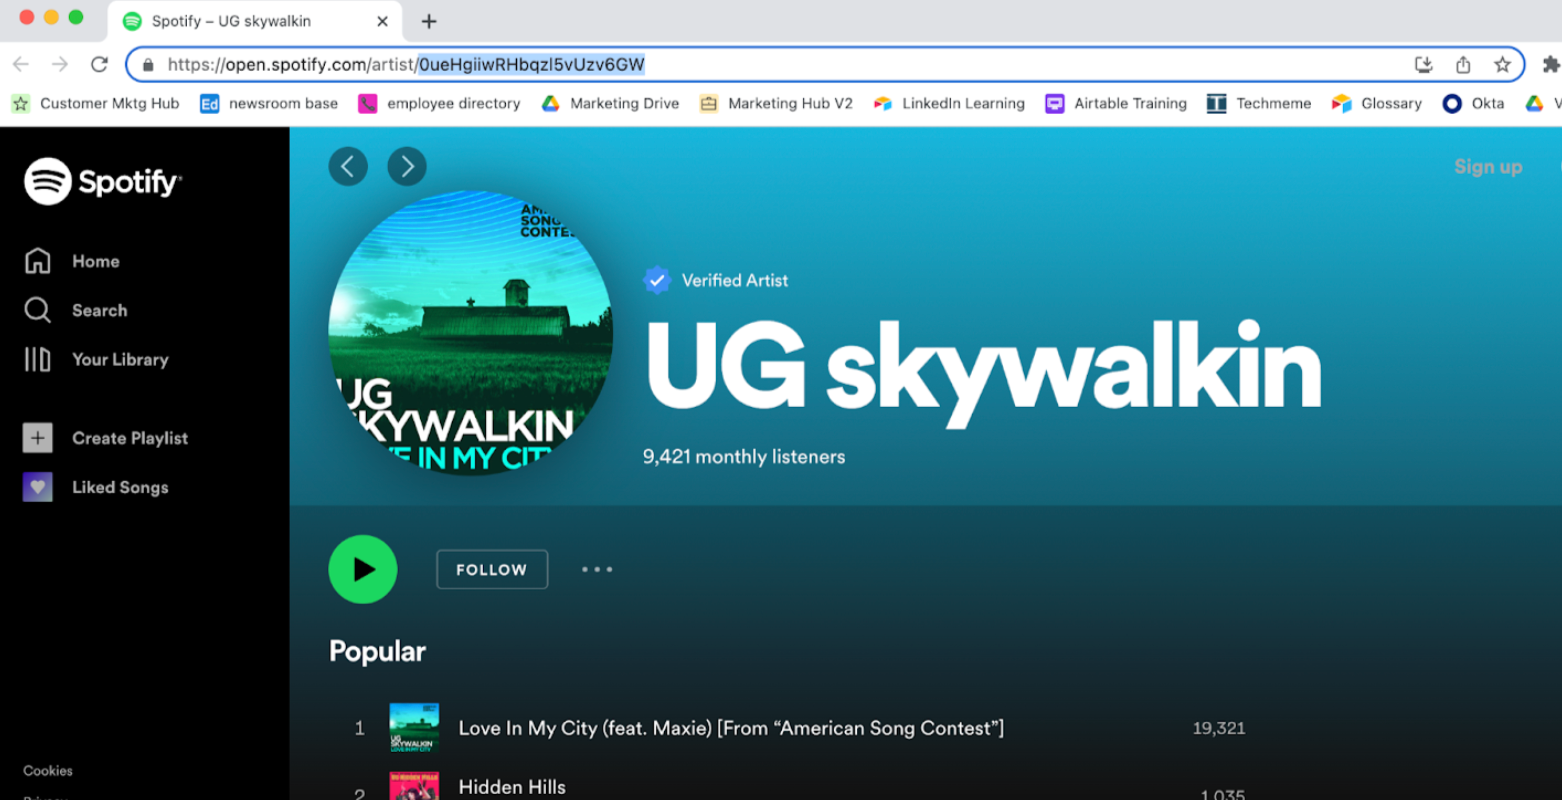
Once you have that ID you can start to ask questions or send queries from Airtable to Spotify, and third-party integrations can make this really fast. We chose an integration in Make, a third-party platform that seamlessly connects APIs between multiple applications. With Make we were able to enter each artist's individual ID, then send a query to check follower counts on each platform and populate our base accordingly.
Clicking through and updating each profile manually just wasn’t an option, as it would have taken far too much time. This integration gets us data on demand. Removing this manual step saved our team more than 20 hours of work a week.
The power of formulas
Without analysis all that data wouldn’t mean anything. And because we didn’t want to do the math ourselves, we set up the formula field to do it for us. We’re using Airtable formulas to make sense of things like percentage growth in followers across platforms, as well as who’s tweeting the most. This involves taking each artist’s max tweet amount (provided by the Make API query to Twitter) and subtracting the artist’s tweet amount from the start of the competition.
As our base architect Stephen O’Grady says, “These formulas are really valuable because they eliminate human error. Also the data is very reliable because it's straight from the source, the social networks.”
Data can tell all different kinds of stories. For example artist Tyler Braden saw a 4.75% increase in Twitter followers and artist ENISA saw a 4.77% increase in followers. But those percentages can be deceiving: Tyler only gained 65 followers, while ENISA has gained roughly 21,000 new followers since the start of this competition. This is why we’re tracking growth in a number of ways so we have context to determine what the follower gains really mean.
Additionally, different artists value different audiences. Yam Haus says they value Spotify more than other social media platforms because that audience is a more accurate reflection of who is really listening to their music (which could make them more money). Similarly, a YouTube following can bring paid ads. Using Airtable filters and custom views, it quickly becomes obvious where artists are choosing to engage and how that engagement is paying them back.
The power of engagement: Why eliminated artists topped our leaderboard
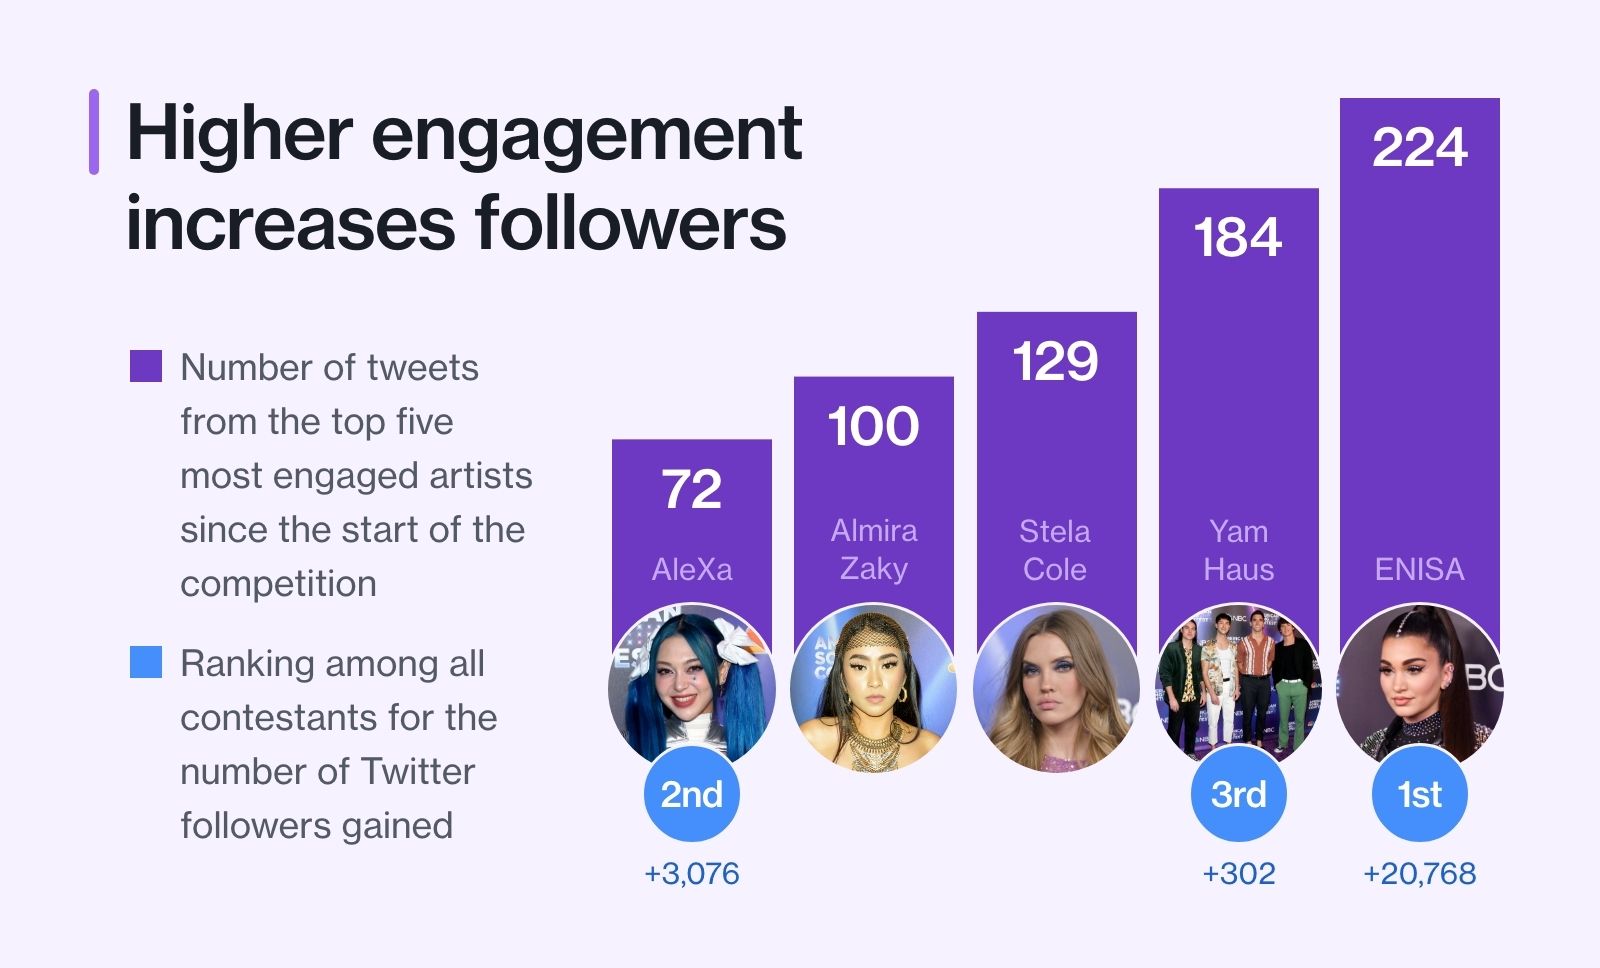
One of the most obvious insights we’re seeing from our base is the power of engagement. It makes sense: social media should be, well, social. The artists who tweet or post the most are gaining the most followers regardless of how they’re doing in the competition.
Yam Haus and ENISA offer proof. Despite being eliminated, they’ve dominated follower growth. As we pointed out that meant 21,000 new followers for ENISA and nearly 3,100 new followers for Yam Haus since the competition began. Both artists started the competition with a strong base of followers. They ranked in the top five for follower counts, next to household names like Michael Bolton and Jewel.
But as the competition progressed, Bolton and Jewel's lack of engagement had consequences—each dropped to around 20th place for follower gains, while AleXa and ENISA claimed the top two spots.
What we’re analyzing next
As data continues to pour in each week and more eliminations stack up we’ll have more ways to interview our data. We’re pulling together views to see if the jury’s pick aligns to social media growth. (The jury is a panel of music professionals who have been able to automatically advance one contestant each week.) We’ll also be tracking viewership by region to see if viewership correlates with the states that are moving forward.
If you want to try to pair these social media APIs yourself, here’s the documentation for Spotify, Twitter, Instagram, and YouTube.
For more on how the artists’ social media numbers are changing, check out our base here. Follow Airtable on Twitter or Instagram to track the competition with us.