Photo Credit: Roman Mager
Imagine you’re prototyping a product or developing a new feature. Your number one concern is: “Will my users like it?” Of course, understanding your users’ needs and desires is difficult, and you might conclude that, short of developing telepathic abilities, it’s impossible to know whether you’re focusing on the right things.
Fortunately, there is actually a way to get inside your users’ heads: qualitative data. Qualitative data is the feedback you get from things like surveys and customer interviews, and it’s immensely helpful for UX research. While quantitative feedback can indicate that a certain number of users are complaining about a particular feature, qualitative feedback allows you to understand the underlying causes of the problems that your users are encountering.
With a more holistic view of how your customers feel about your product, you can begin to build a product that actually solves users’ specific problems, rather than just building a product that has features A, B, and C.
The impact of using qualitative feedback to help drive your product development is undeniable. As Hiten Shah, founder of Quick Sprout, Crazy Egg and KISSmetrics writes: "Getting to product/market fit and keeping it as the market evolves is critical to creating a sustainable growing business. Doing qualitative research like the product/market fit survey can help you understand users deeply. Armed with that information, you can then optimize your product and marketing efforts to get you more people who consider your product a must-have, faster."
But before we get ahead of ourselves, it’s important to remember that while qualitative data is great, it gets messy fast. You need a methodical system that helps you collect, process, and act on qualitative feedback. We’ll walk through a three-step process that you can follow to help quantify your qualitative research.
Step 1: get qualitative data
Before you can do anything to your data, you need to actually obtain it first. There are a variety of methods you can use to collect qualitative data—like customer surveys or interviews, for example—each of which has its own distinct advantages and disadvantages.
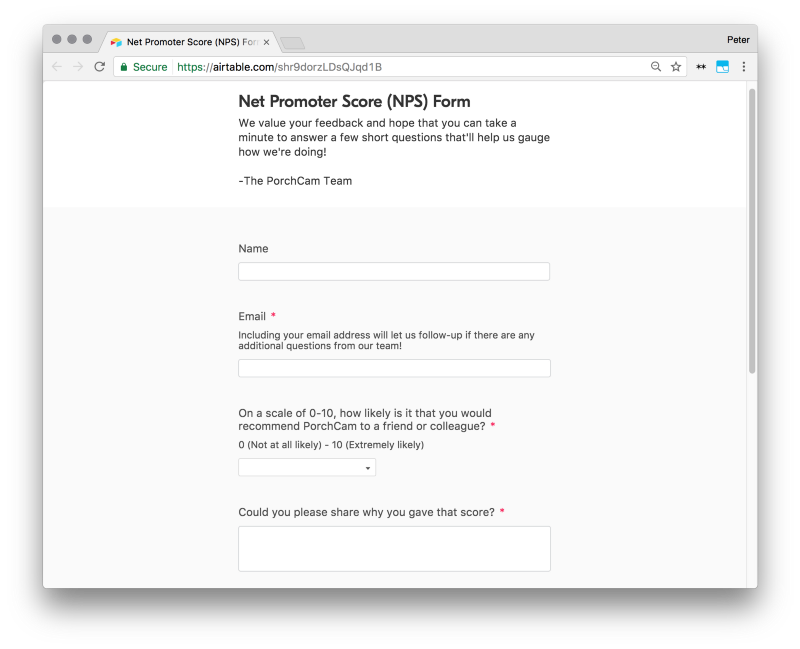
One example of a method you can use for collecting qualitative data is NPS surveys, used by many companies. For a software company with a wide variety of different products (like Atlassian, for example), NPS surveys are a simple, effective way of finding out how each target audience feels about each product—without having to spend hours creating custom surveys for each product.
NPS surveys are great because they give you two pieces of information:
- An NPS score that gives you a sense of how customers feel about the product
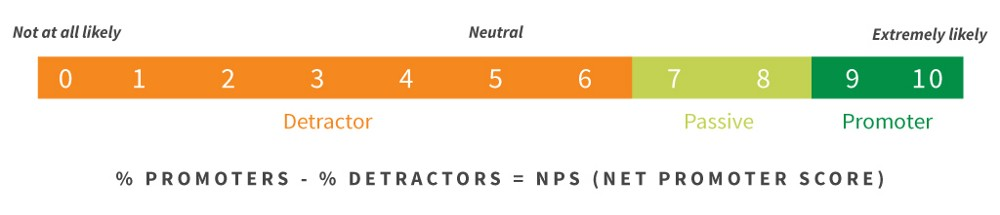
- A “Why?” section that lets customers spell out why they love your product, or what needs improving.
No matter which method you use for collecting qualitative feedback, you’ll need somewhere to store all of this information. A database like Airtable is incredibly useful for turning feedback into structured data. (As a starting point, may we suggest this template for collecting NPS survey responses, or this template for conducting user interviews?)
Make sure that wherever you’re recording your qualitative data, you’re also recording important quantitative data in the same place — things like how long a customer has used your product or the size of their company. Sorting through feedback using specific themes will make it easier for you to look for specific requests later on.
Regardless of the system that you choose, make sure you build a system that you can run on autopilot. Getting a steady stream of quality customer feedback without expanding your team or breaking the bank will make sure you can focus on the next two steps of the process — processing the feedback to gain insights, and actually making improvements to your product.
Step 2: filter and sort your data
Now that you have your data, you need to create a system to filter it for relevant information. Add tags for any general topics (e.g. “rich text”), or specific feature requests mentioned (e.g. “Markdown support in embeds”). Once you’ve organized all your feedback and tagged it as necessary, it’s time for you to process the feedback and turn it into insights.
Say you’re making improvements to your onboarding process. You want to figure out what pain points new customers are experiencing that may cause them to churn early on, or why they might not be willing to recommend your product to a friend.
To get customer feedback, you conduct an NPS survey using an Airtable form. Once all the responses are in your Airtable base, you can create a view that filters only survey results from people who are still in the first few weeks of using your product, and also are less likely to recommend it to a friend.
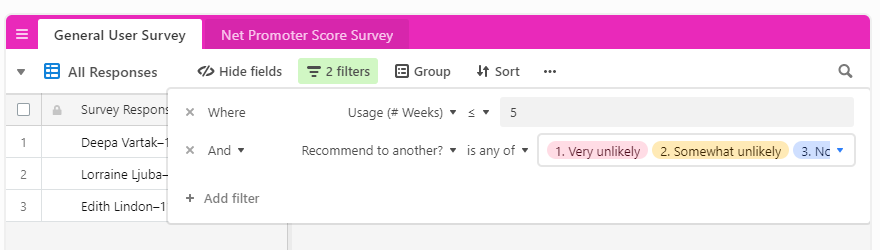
This way you’re only looking at customers who have experienced specific pain points with your product. You want to focus on negative comments rather than positive feedback so you know what to work on next. Since all your information is collected in one place, it’ll be easy to look more closely at what each customer’s pain points were to narrow down what issues you should be addressing.
Step 3: prioritize feedback into product development
Every customer is going to experience different pain points and while you may want to start fixing every single one immediately, it just isn’t feasible. So you need to prioritize the feedback you’ve received to tackle the most pressing issues first.
When deciding priority, you want to look at more than just one measurement. Just because one feature has the lowest NPS score or the highest number of feedback items doesn’t necessarily mean it’s the item that should have the highest priority.
When Atlassian runs NPS surveys, they categorize qualitative feedback responses using different labels, and then look at two metrics to help determine priority:
-
The number of feedback items for each category or label
-
A calculated NPS score for each category or label
In order to have the highest impact on overall NPS scores, the goal is to focus on a feature that has a large number of feedback items as well as a comparatively low NPS score. This approach to NPS gives Atlassian a holistic view of what the highest priority items really are.
Using a similar approach, let’s take a closer look at our results from step two to determine which feature should be our highest priority.
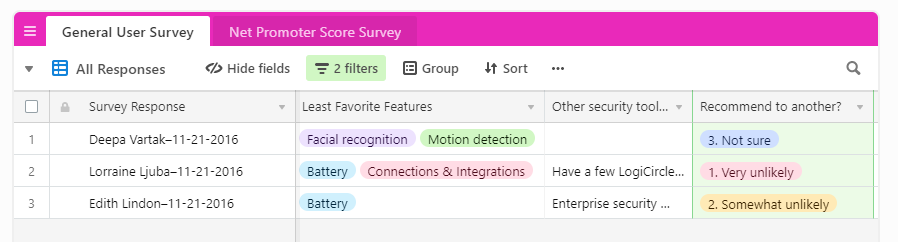
From the three customers who fall into our filters, we see that there are four different features labeled as “least favorite.” Let’s break down how to choose priority:
-
First we notice that the feature that comes up twice is “Battery.” This may seem like that’s the feature we should be targeting, but let’s look at another metric before deciding.
-
Under the “Recommend to another?” category, the two customers who are least likely to recommend are also the ones who did not like the Battery feature.
While in this case it happened to be that the two metrics lined up to help determine which feature should be the highest priority, always make sure to look at all the information you have before making a decision.
Get inside your users’ heads
Making sure that you’re appealing to your customer’s needs is the most important thing to make sure your company stays successful. But it’s hard to know what those needs are without getting inside your customers’ heads. Qualitative surveys are a great way to collect data — but only if done properly. Without a plan, the amount of data can get overwhelming and time-consuming.
Follow this three-step plan to help you filter and prioritize your data, and figure out what the most pressing issues are. This way you can continue to work towards developing the products your customers want and find product-market fit.