Although the roots of UX as a discipline are commonly tied back to Taylorism, the Toyota Production System, and the classic industrial design tome Designing for People by Henry Dreyfuss, the term “user experience” is believed to have originated at Apple in the ’90s, following the hire of Donald Norman.
I invented the term [UX] because I thought Human Interface and usability were too narrow
A cognitive psychologist by training, Norman wanted to expand the practice of human interface design beyond merely the arrangement of pixels on the screen, to encompass something larger: “I invented the term [UX] because I thought Human Interface and usability were too narrow,” said Norman. “I wanted to cover all aspects of the person’s experience with a system, including industrial design, graphics, the interface, the physical interaction, and the manual.”
Toward a New UX Research Workflow
While there are a lot more ways you can do UX research today than were popular in the 90s, the overall research workflow often looks very similar. As a new feature or product launch is planned, researchers conduct studies by interviewing users. They synthesize feedback using a messy combination of Post-it notes, whiteboards, and spreadsheets.
At the end of the study, researchers write up a report and present it to a product team.
The problem is that when presented as one-off reports, UX research quickly becomes siloed. Spreadsheets get lost in messy email threads, and research reports are forgotten over time.
Research is about creating shared understanding...If researchers are isolated, they are just one more data point.
WeWork’s VP of UX Research Tomer Sharon expresses this problem well: Research is about creating shared understanding. Different people in the team have different assumptions and sometimes data about users, their needs, and behaviors. If researchers are isolated, they are just one more data point.
Developing a shared understanding of your users provides a lift to every part of your company. It helps product prioritize features, marketing coordinate launches and onboarding, and support focus even more on the customer.
To build a user-centric cycle of improvement, you need to create a repository of research that everyone in your company can draw upon. A good research workflow supported by accessible data enables your entire company to make better, more informed decisions.
Here’s how:
-
Collect input: UX research might take the form of usability tests, surveys, or user sessions. Streamline the way that you schedule user interviews and collect data so that you can focus on results, rather than logistics.
-
Structure the data: To make session notes and individual research reports easily accessible, you have to give the data on overarching structure that lasts over time.
-
Mine for insights: Different teams will have different ways they want to use the data. Make it easy to slice and dice information in different ways.
By consolidating your findings into a centralized database, you can streamline your UX workflow, turn qualitative user feedback into structured, quantifiable data, and systematically process that feedback for insights.
Collect user feedback
UX research is the process of figuring out how a product or service will work in the real world.
In practice, this might mean setting up user interviews, usability tests, or surveys. Research becomes siloed when the responsibility for collecting this feedback falls entirely upon researchers. By opening up this process from the beginning, you can create a single place where everyone in an organization can access and collaborate on user research.
You might break this initial stage down into three discrete steps:
-
Create a list of users to talk to.
-
Schedule interviews with users and people on your team.
-
Collect session notes in a single place.
Start by putting together a list of users to talk to. These might be your existing customers, people who have tweeted at you, or even friends. Then fill in contextual information around each user — their contact information, social profile, role, and company.
That makes it really easy to reach out to these users to schedule interviews for specific research studies, connect them to people on your team, and record all this information in a single place to share with everyone on your team afterwards.

You can create a form where interviewers can log metadata, notes, and impressions around the interview:

This helps a lot when you’re asking PMs or designers on your team to interview users. They can easily input session notes according to pre-defined fields, insuring that the right information is captured in a standard way, and then collected in a central place for easy access later.
Turn feedback into structured data
Once you’ve captured your interview notes, you have a bunch of raw, qualitative information. Most people on your team won’t want to look at a spreadsheet that’s filled with messy notes and random observations. To make all the feedback you’ve collected useable, you have to structure the data.
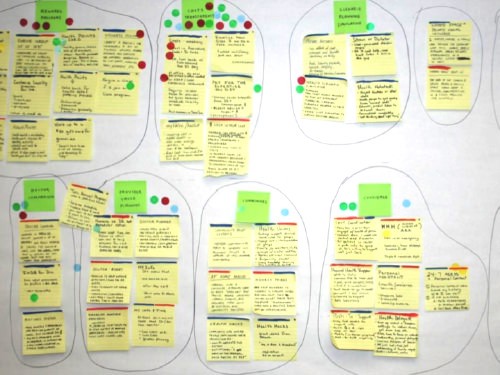
In traditional UX research, this often happens in a physical space. You list out research goals on the whiteboard, tape photos from sessions to it, and you stick your research goals on the walls, tack up photos from the sessions, and visually organize research via sticky notes. With your database, you have to translate this process digitally.
The initial notes you have from a user feedback session might look something like this:

Within a single session, you might get multiple feature requests and more. In Airtable, we can create a database that structures individual feedback sessions into different field types.

In the Airtable base above, we’ve tagged feedback sessions with information including:
-
Session Recording URL: a link to the session recording. This makes it easy for anyone to access the primary data for each session.
-
Study: this is a linked record field that connects each user session to the research study it was for.
-
Overall Feedback Score: quantitative measure of a user’s overall satisfaction with the product.
-
Session Type: a single-select field type that categorizes each session according to type.
-
Notes: field where freehand notes can be recorded.
The field types that you select for your database depend on how you want to use the research. Overall, you want the flexibility to sort and filter your data in different ways, while maintaining an overall logical structure that makes research easily accessible to all the different people on your team.
Process feedback for insights
Once you’ve conducted feedback sessions with users, the next step is to process this feedback into insights that are easily digestible for your whole team. You want to build in the ability to analyze UX data in different ways, so separate teams can find the information they need without having to leave the database.
You can do this by creating separate tables and views for each team that highlight the information most likely to be useful to them.
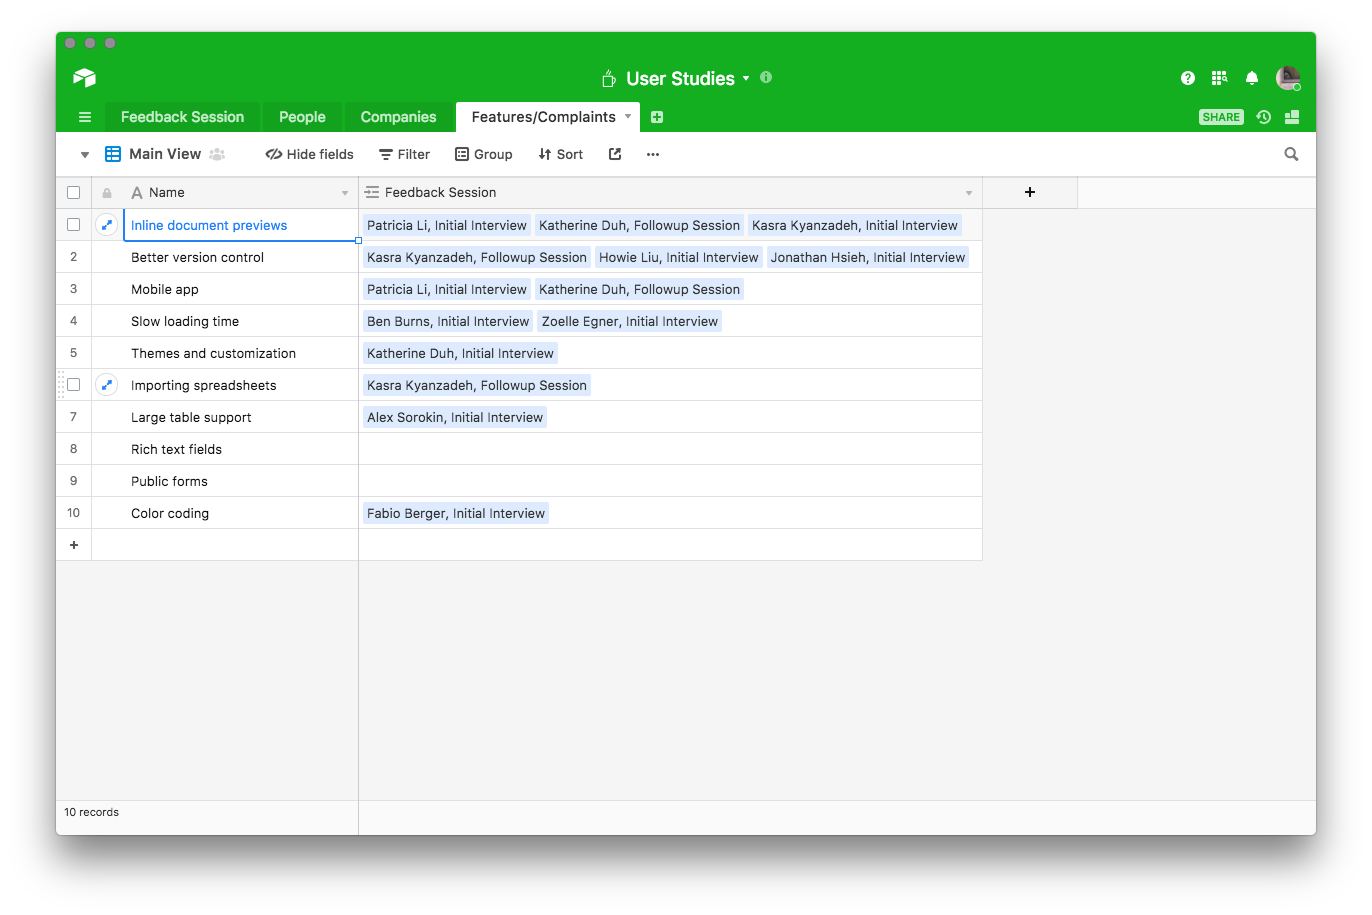
Let’s say your product team wants to mine user feedback to prioritize what features to build next. Taking the database we built above, we can create a new table called “Feature Requests.” In this table, we can go through the notes for each feedback session, pull out the feature requests, and link them together.

Once feature requests are connected to individual feedback sessions, we can create a new field that counts the number of requests for each new feature:

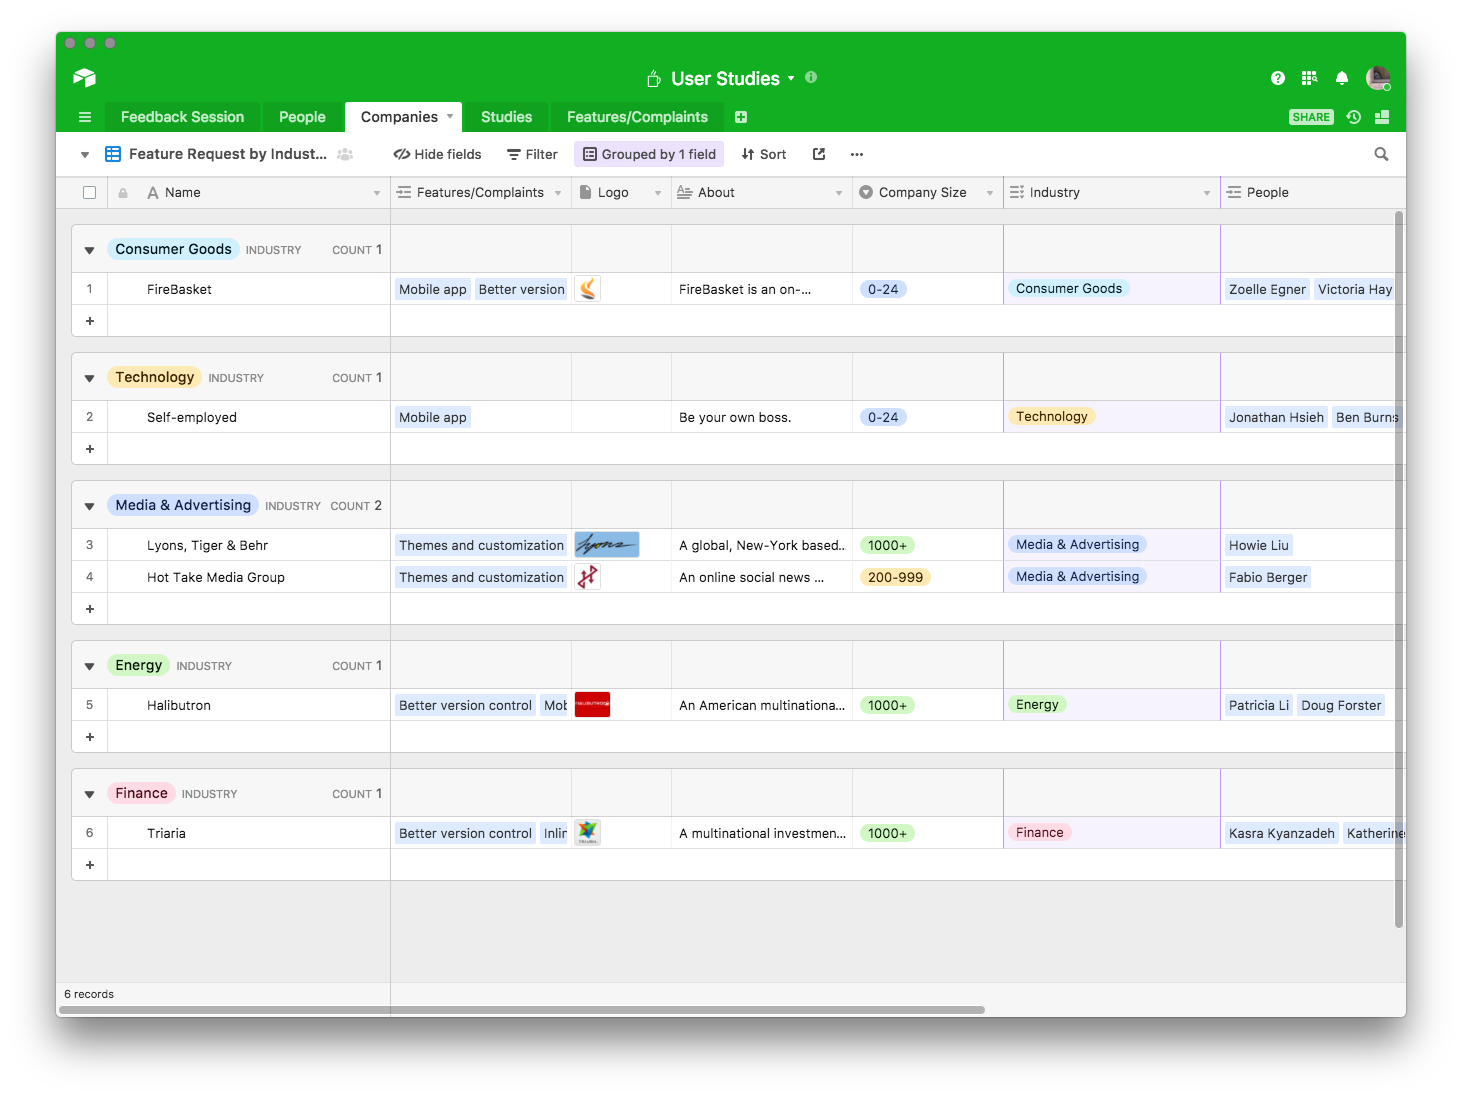
While your product team is focused on figuring out what features to build next, your marketing team might want to dig into user research to test different landing pages upon your next feature launch. You can create a new view in the “Companies” table that groups feature requests according to industry vertical.

Your marketing team can then do further outreach for customer testimonials, create vertical-focused landing pages, and make sure the right users are notified upon the launch of a new feature.
Meanwhile, for support you might create an altogether different view that groups feedback session according to overall satisfaction score:

That gives your support team the ability to see which customers are unhappy, so they can reach out to them directly.
Providing the ability to manipulate data in different ways allows people across teams to spot relevant trends and patterns within user research findings. Rather than creating a single, static research report that you send out to your team, you have a living database where all your research can live and evolve. As you talk to more users over time, you build your collective repository of knowledge.
Open UX
UX research is a tool that allows an organization to focus its product, marketing, and engineering efforts around real user wants and needs. The challenge is that different teams have different priorities and outcomes they want to achieve with user research.
Curious how other teams approach UX research? Learn how Begoña Chorén Jiménez, Lead UX Researcher at Autodesk, defines problems, juggles time zones, and extracts valuable insights from every user interview, over at Creators and Creatives.
Learn more about UX research repository tools here.

