Great marketing appears organic and effortless on the surface. But behind the scenes, each project hinges on coordinating a series of moving pieces through various stages of ownership and shifting deadlines. Creating a comprehensive strategy and ensuring its success means placing a premium on organization.
Airtable Apps can extract insights from a wealth of information, allowing you to make faster and more informed creative decisions. Track the status of ongoing campaigns, maintain a cohesive brand identity, visualize your team’s bandwidth, and more, so you can spend less time focused on the minutiae and more time executing brilliant ideas.
Follow these steps for a more seamless marketing strategy:
Count down to the next big launch
Maintain brand guidelines
Manage resources like a pro
Create your quarterly marketing roadmap
Track campaign status by customer stage
Count down to the next important launch
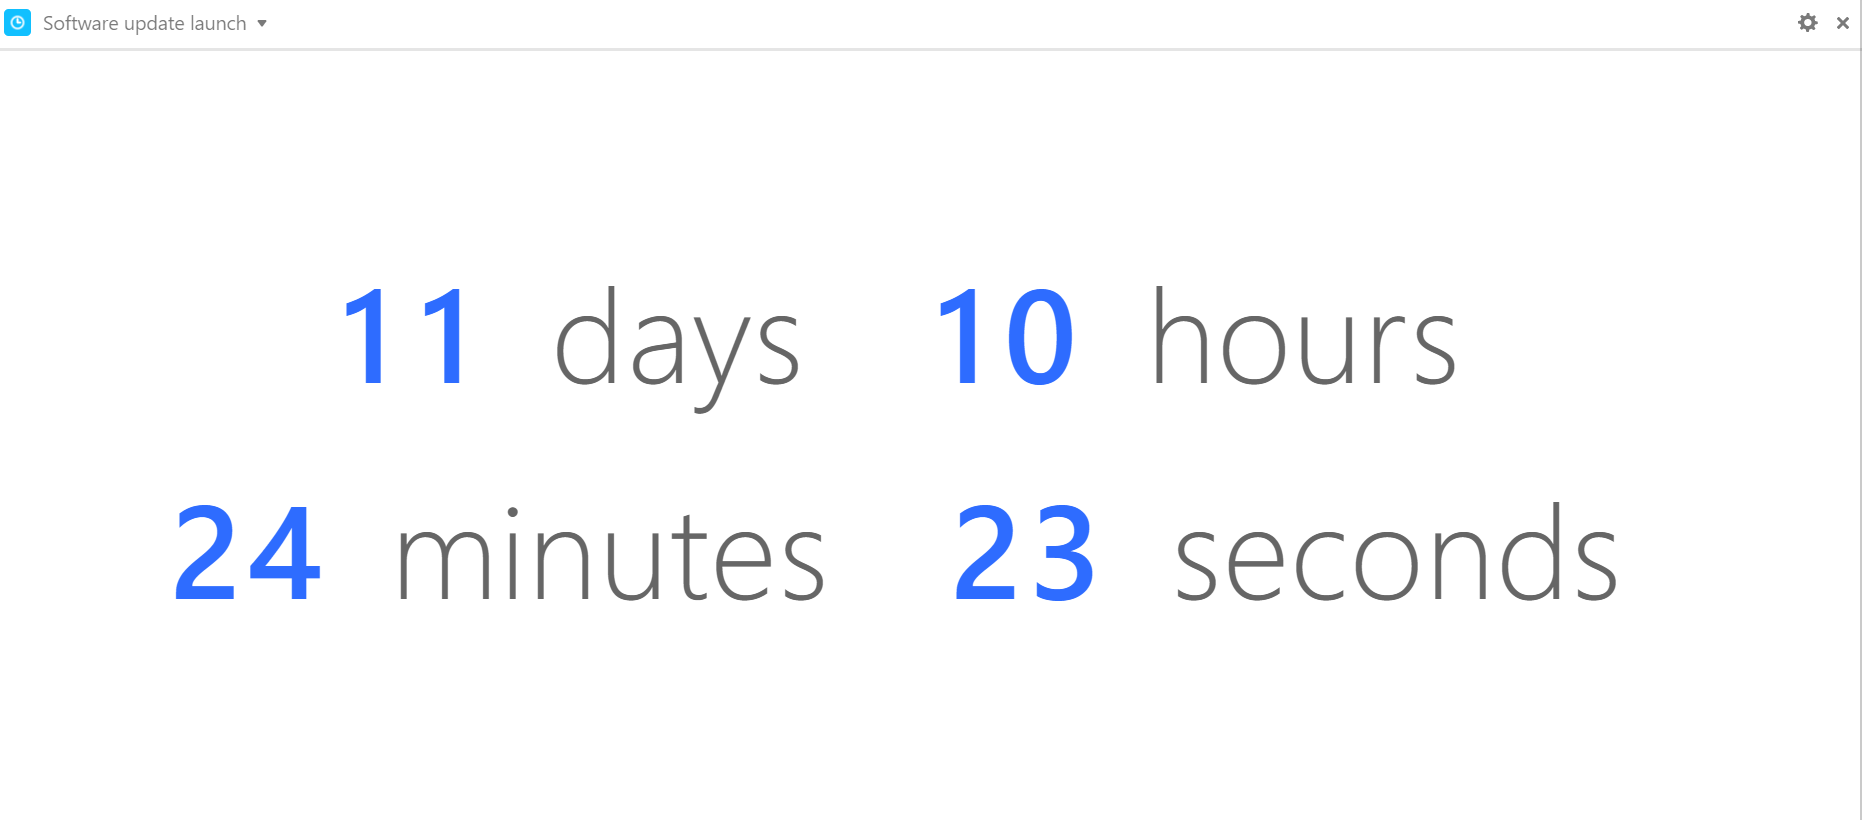
Marketing numerous features with competing resources makes it imperative to keep your team apprised of deadlines. The countdown app allows you to measure the time until the next big launch, making dynamic use of the information in your base.
Step 1: Make a view that displays upcoming launch dates.
Create a view in your features table that's filtered to only show future launch dates.
Step 2: Add a countdown app.
Open the apps menu, select the option to add an app, and add a countdown app to your base.
Step 3: Choose the date you want to count down to.
Toggle the Date from view option and select the view with upcoming launch dates. Make sure Earliest date is selected and check off the units you'd like to track.
Maintain brand guidelines
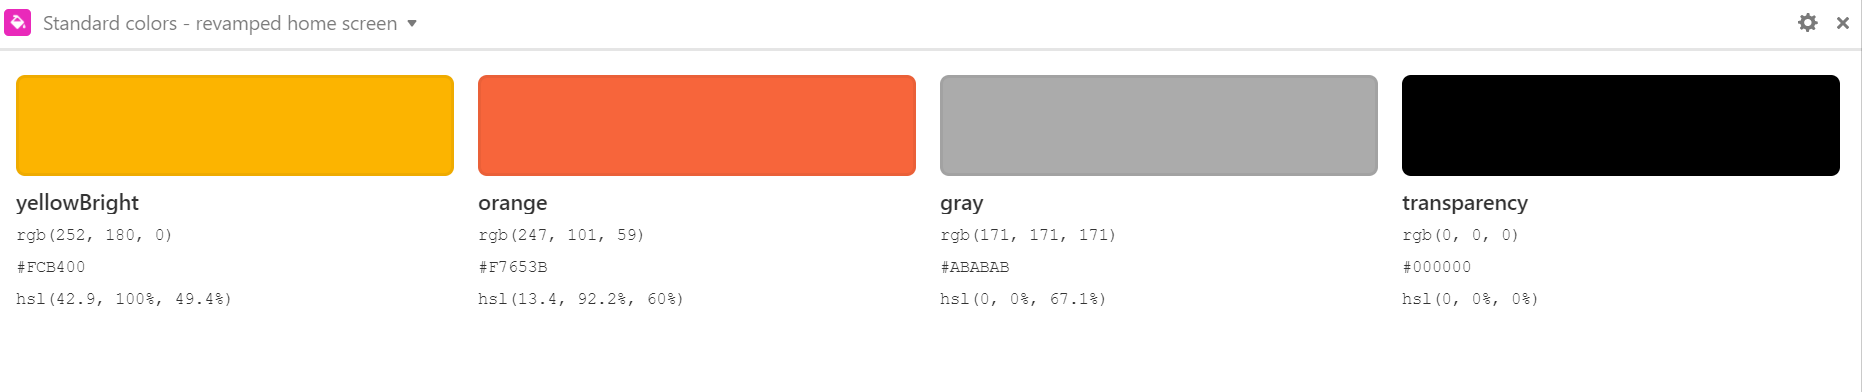
The color palette app makes it simple to maintain consistent branding across teams by pulling easily-copied HEX, RGB, and HSL codes and color names from your base into a palette.
Step 1: Make sure fields are properly labeled.
This app will draw from specific fields of the appropriate table in your base. Make sure one field contains names for your swatches and another field contains color codes in HEX, RGB or HSL.
Step 2: Add a color palette app.
Next, choose the add an app option from the apps menu and add the color palette app to your base.
Step 3: Configure the color palette app.
Use the settings to specify the correct table and view for your app. Select the field for your swatch names and the field for your color codes. You can select any color’s RGB, HEX, or HSL code directly from the apps panel to copy that code to your clipboard.
Manage resources like a pro
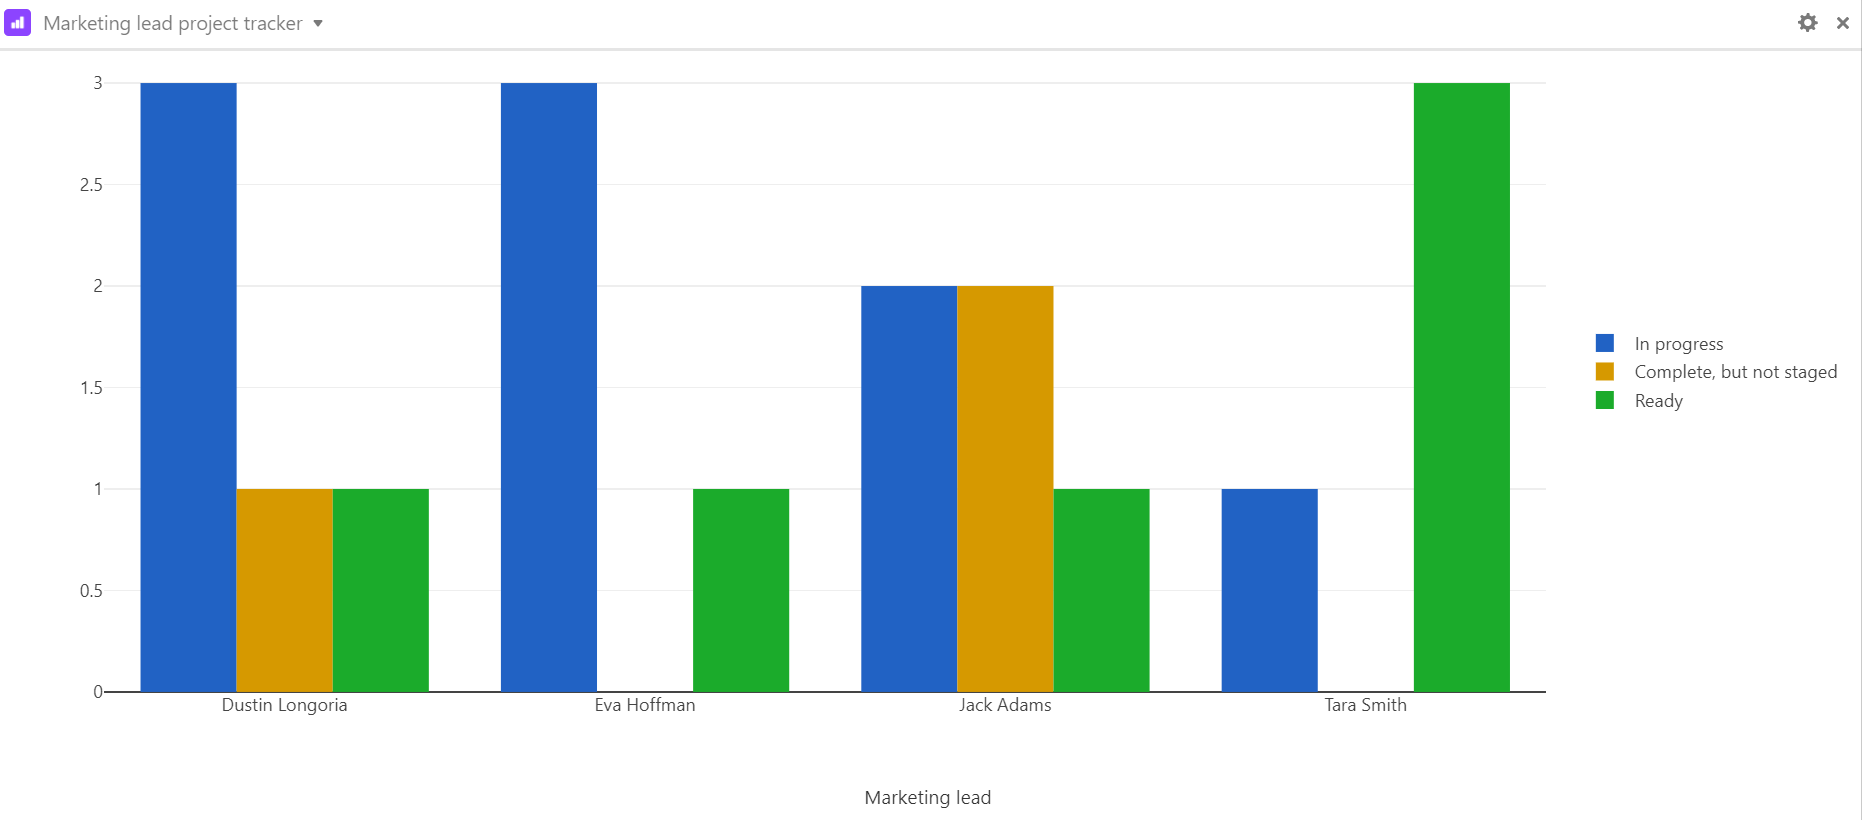
The chart app makes managing people a breeze, giving you a high-level look at project ownership among marketing leads, along with each project’s status.
Step 1: Enter your project details.
Make sure that your base has a table listing features in various stages, along with single-select fields indicating each feature’s respective marketing lead.
Step 2: Add a chart app to your base.
Open the apps menu, click the add an app option, and add a new chart app to your base.
Step 3: Adjust the chart app to fit your needs.
The chart app can make three different charts—a bar chart, a line graph, or a scatter plot. A bar chart is most useful for comparing specific X-axis values, which makes it a natural choice for counting the number of projects each collaborator is assigned to lead in a project management base. We recommend that the X-axis be the name of the marketing lead, while the Y-axis should be the feature status field.
Create your quarterly marketing roadmap
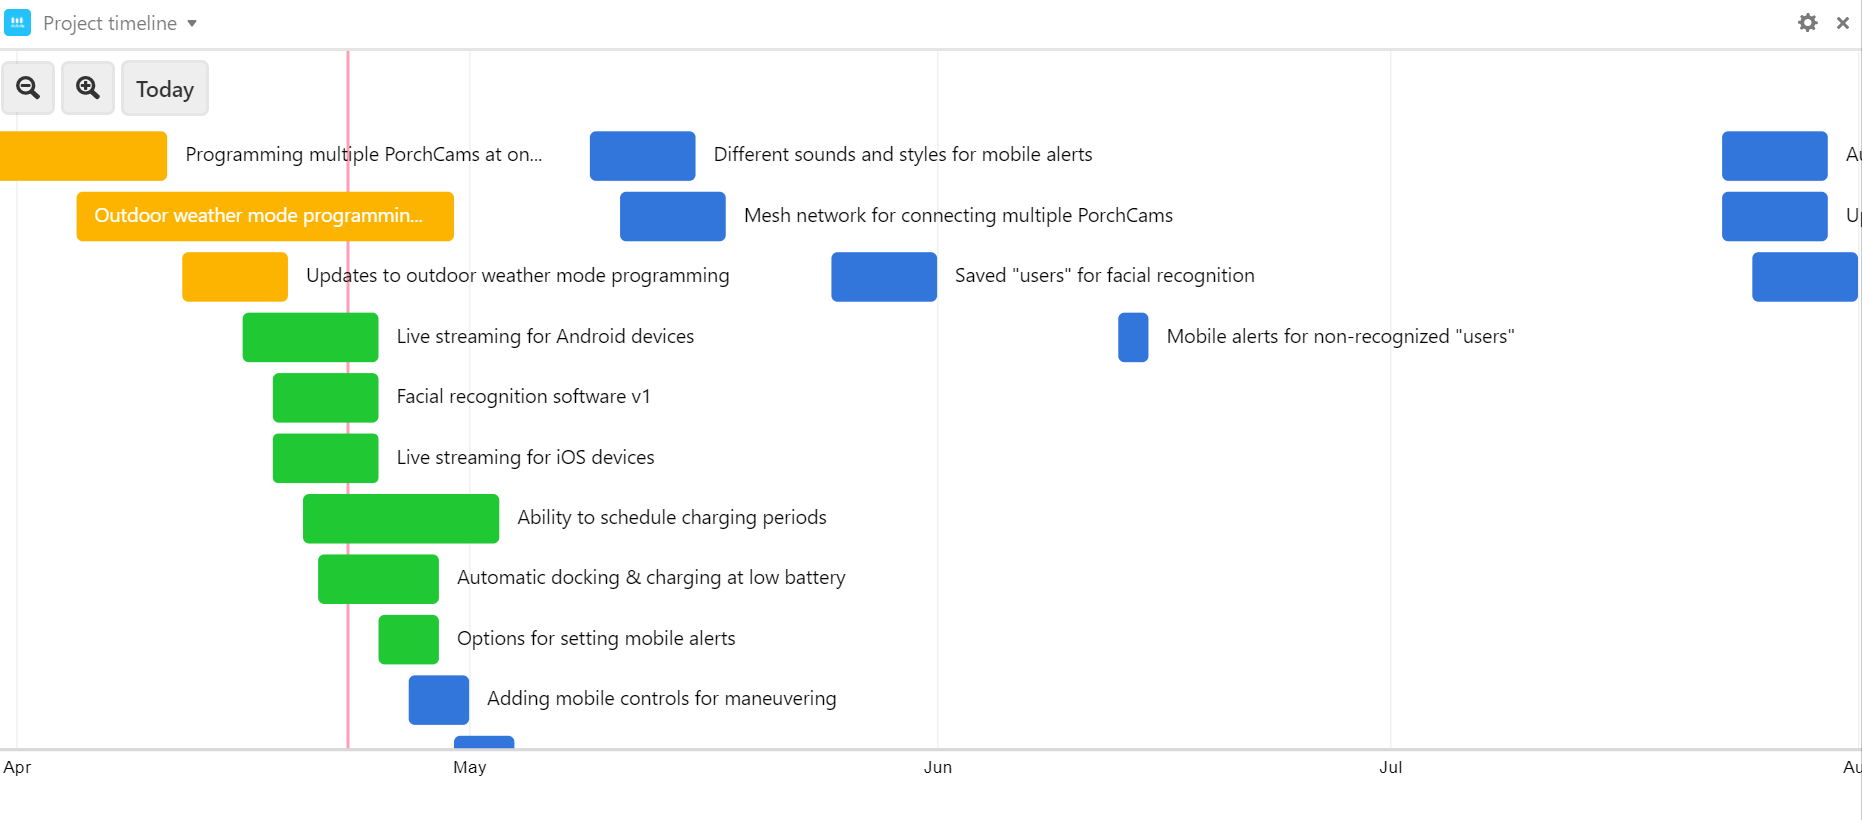
Managing multiple projects means juggling multiple timelines, with their variable completion dates, launch dates, and more. A timeline app creates a reference to help you quickly visualize the lifecycles of each campaign in conjunction with each other.
Step 1: Add a timeline app.
Open the apps menu, click the add an app option, and add a timeline app to your base. In this case, it makes sense to point the table field toward the Features table, which contains the works-in-progress you need to be aware of. Select a view that corresponds to the set of dates you'd like to visualize over time—as narrow or wide as your needs dictate.
Step 2: Adjust the timeline range and colors.
Choose your preferred start and end date fields—we’ve selected the target completion and target launch dates, respectively. You can customize the color of the records on the timeline, too. We colored each entry by feature status for easy reference.
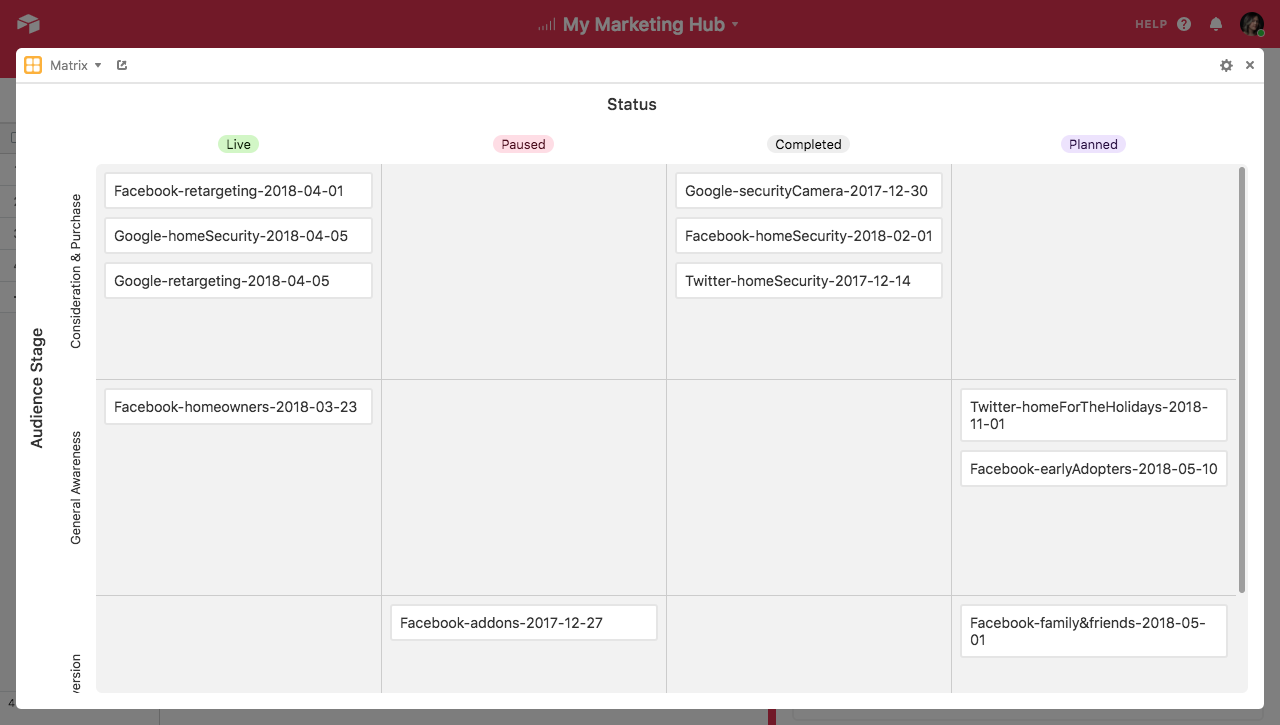
Track campaign status by customer stage
Visualizing the status of multiple marketing campaigns in various lifecycle stages can quickly become more confusing than insightful. Use the matrix app to quickly keep tabs on each project’s status with customizable parameters, like audience stage.
Step 1: Add a matrix app.
Choose the add an app option from the apps menu and add a matrix app to your base.
Step 2: Configure the rows and columns.
Set the app to point to the table and view containing the records you want to map onto the matrix. Next, pick the field you want to use to define your rows and the field you want to use to define your columns. In this case, we'll set the Audience Stage field to define the rows and the Status field to define the columns. Depending on your preference, you can also choose to only show rows/columns containing records.
Step 3: Arrange the records to your liking.
Once the matrix app is set up, you can move the record cards between different cells in the matrix to redefine their values; for example, you can move live campaigns to the completed column once they're done.