Launching features that delight your users is key to running a successful product team, but it's no easy feat. The process of scheduling interview sessions with users, turning their feedback into actionable insights, and then translating those insights into functional and timely product updates takes a lot of coordination.
A nimble product team needs quick access to the goldmine that is user feedback—and an easy way to put resources toward meeting those needs. Whether you're shipping features every month or every day, keeping tabs on who's working on what and when can get complicated fast.
Airtable Apps can illustrate your roadmap, org structure, and team bandwidth, bring automation to your user testing sessions and insight gathering, and make last-minute launch date changes a breeze.
Here's your step-by-step path to a more integrated UX research and product planning workflow:
Visualize your roadmap and your team
Coordinate testing sessions and translate user responses
Analyze feedback and pain points in real time
Anticipate—or push back—your next launch
Visualize your roadmap and your team
As an efficient product team, you're balancing a wealth of ongoing projects and just as many stakeholders. The timeline and org chart apps can give a high-growth org quick visibility into an expanding product team, or help cross-functional teammates grasp who's who at a glance.
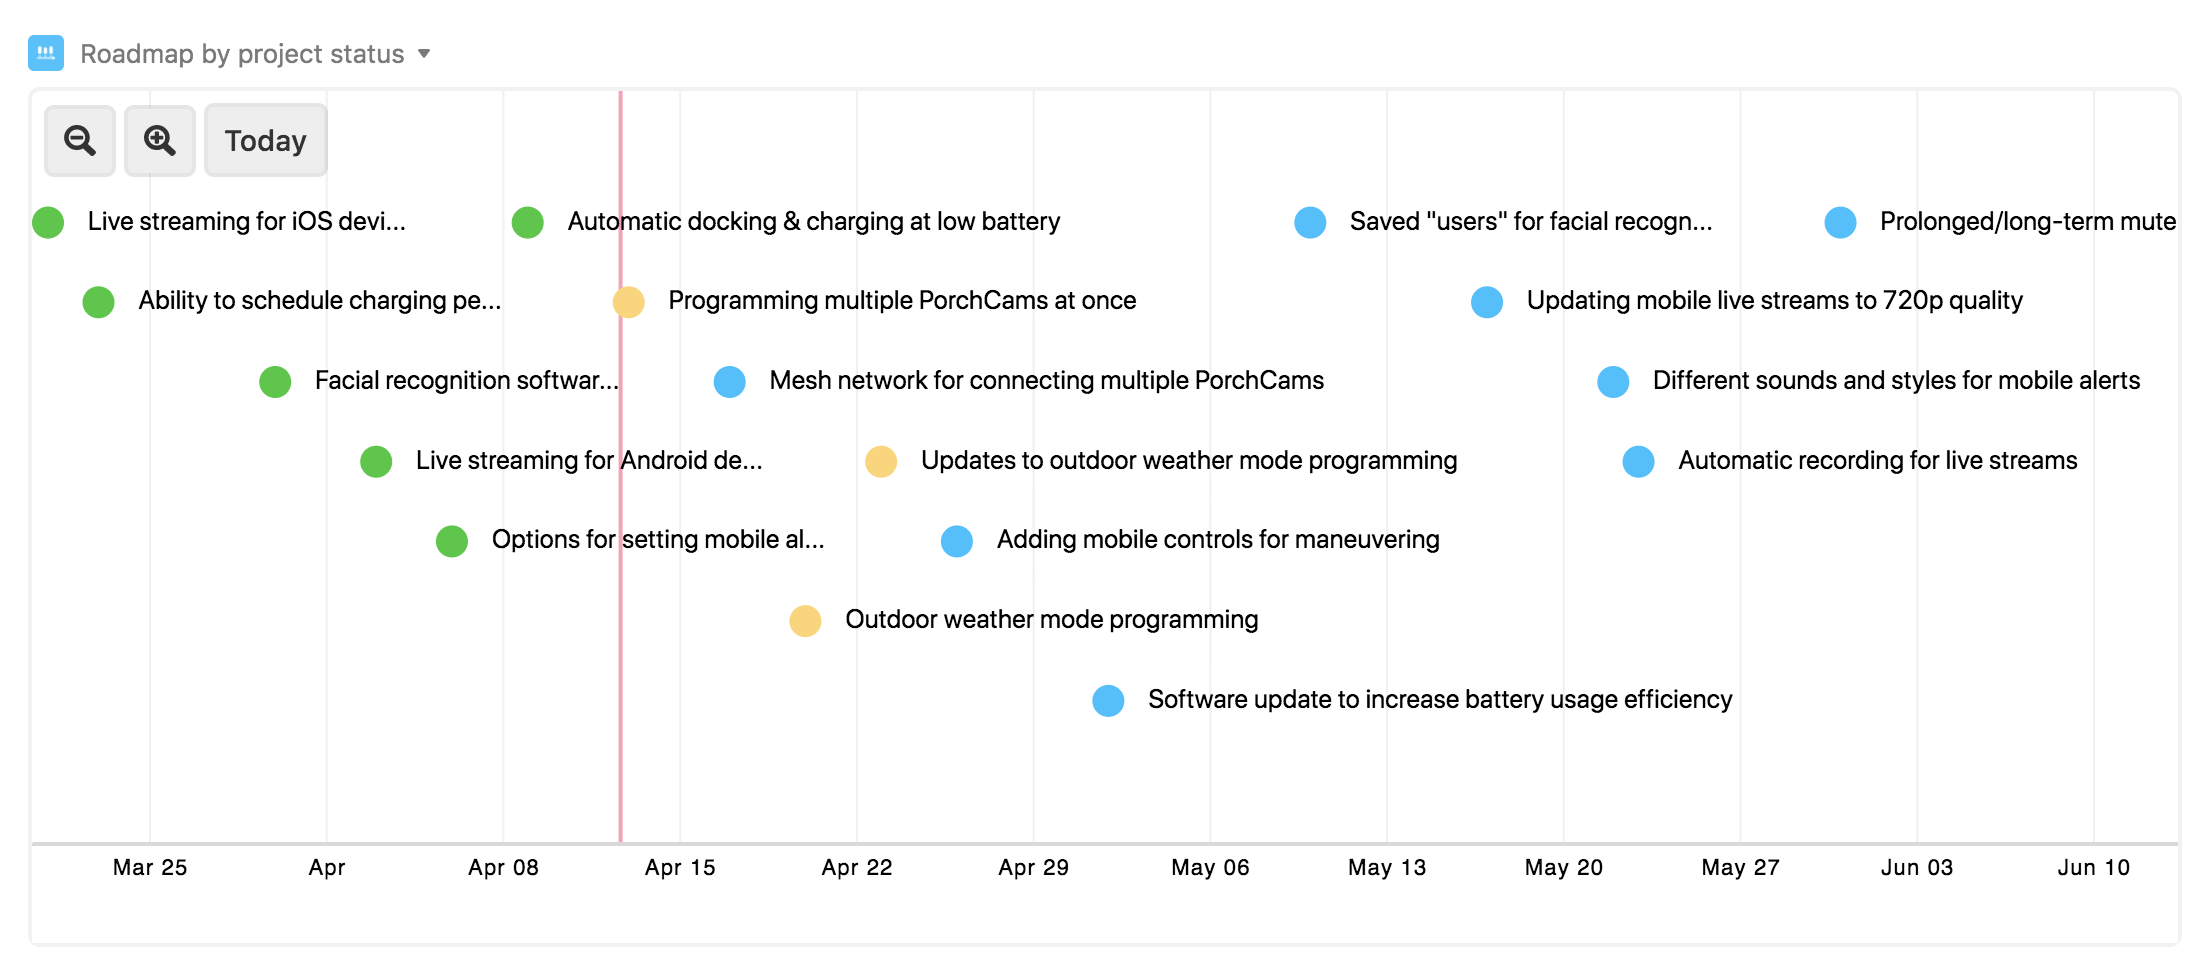
The timeline app turns your list of upcoming work items into a fluid, always-up-to-date look at your roadmap.
Step 1: Make a project table.
If you don't already have one, make sure that your base has a table that lists your projects and includes details like lead, completion date, launch date, and status.
Step 2: Add a timeline app.
Open the apps menu, click the add an app option, and add a timeline app to your base. You'll want to point the table field toward the one that holds your projects.
Step 3: Adjust the timeline range and colors.
Choose your preferred date field. Above, we've selected the target launch date for each feature. (Tip: you can also use a date range on the timeline, to visualize the start and end dates for beginning and completing a project, for instance.) You can customize the color of the records on the timeline, too—try coloring according to the current project status.
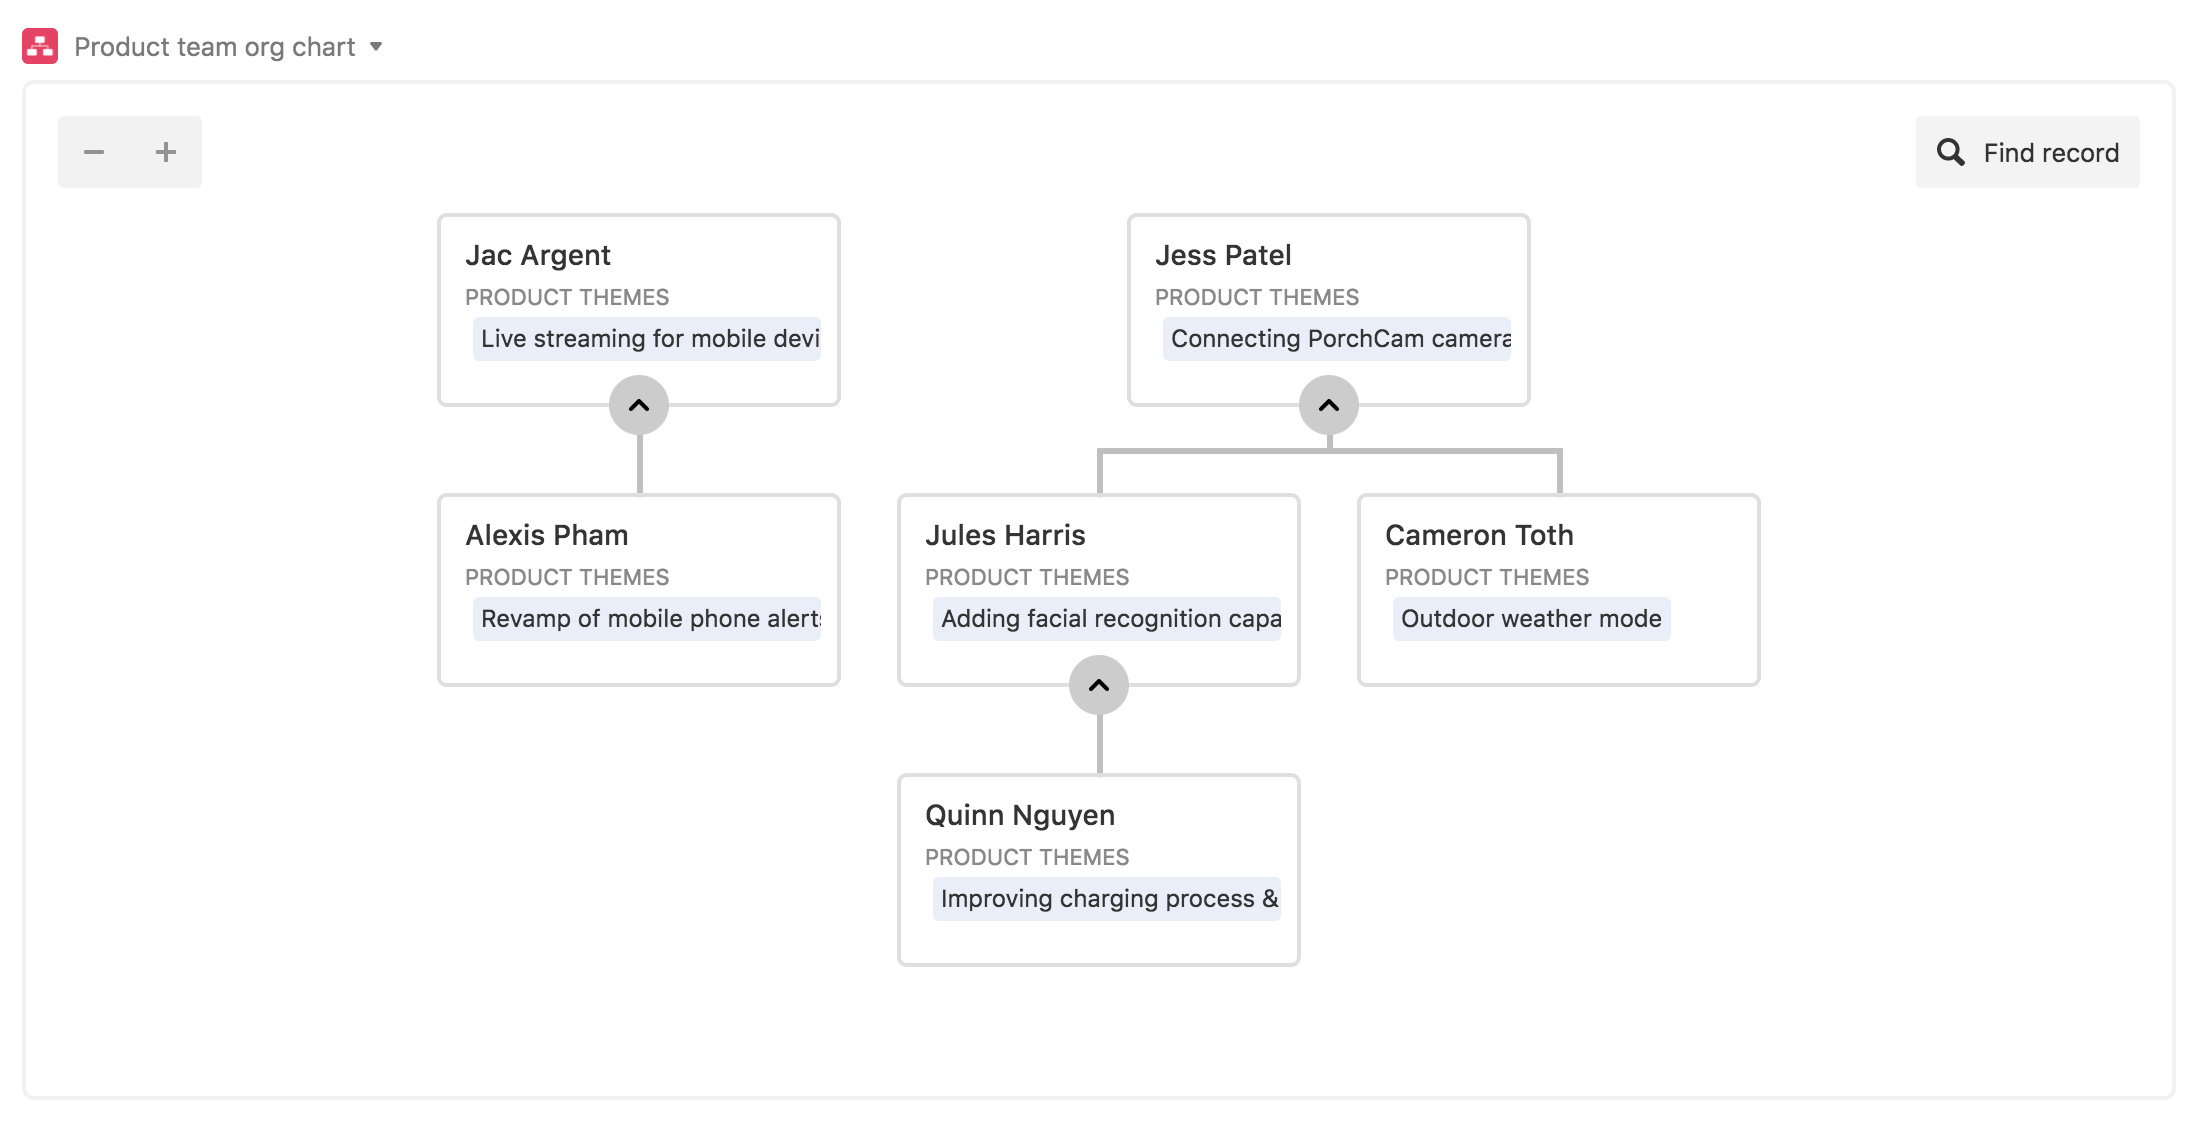
Use the org chart app to map out your team's structure, displaying reporting relationships and focus areas.
Step 1: Create reporting relationships.
To add hierarchy to your team table, create a linked record field that indicates who a team member reports to. Note that this linked record field must link to the same table in order to power the org chart. (So: if you're in the Team table, create a linked record field to itself, the Team table.)
Step 2: Add an org chart app.
Head to the apps menu and choose the add an app option. Select the org chart app and add it to your base.
Step 3: Configure the org chart app.
Choose the relevant table and view for your org chart, then select the field you created in Step 1 that denotes reporting structure. Indicate whether this field indicates a parent (ie. manager) or a child (ie. report). You can optionally include a secondary field, like a focus area, to display other helpful information in your chart.
Coordinate testing sessions and translate user responses
Your users' feedback is invaluable when it comes time to prioritize features. Take some of the logistical work out of capturing user insights with the translate and send SMS apps.
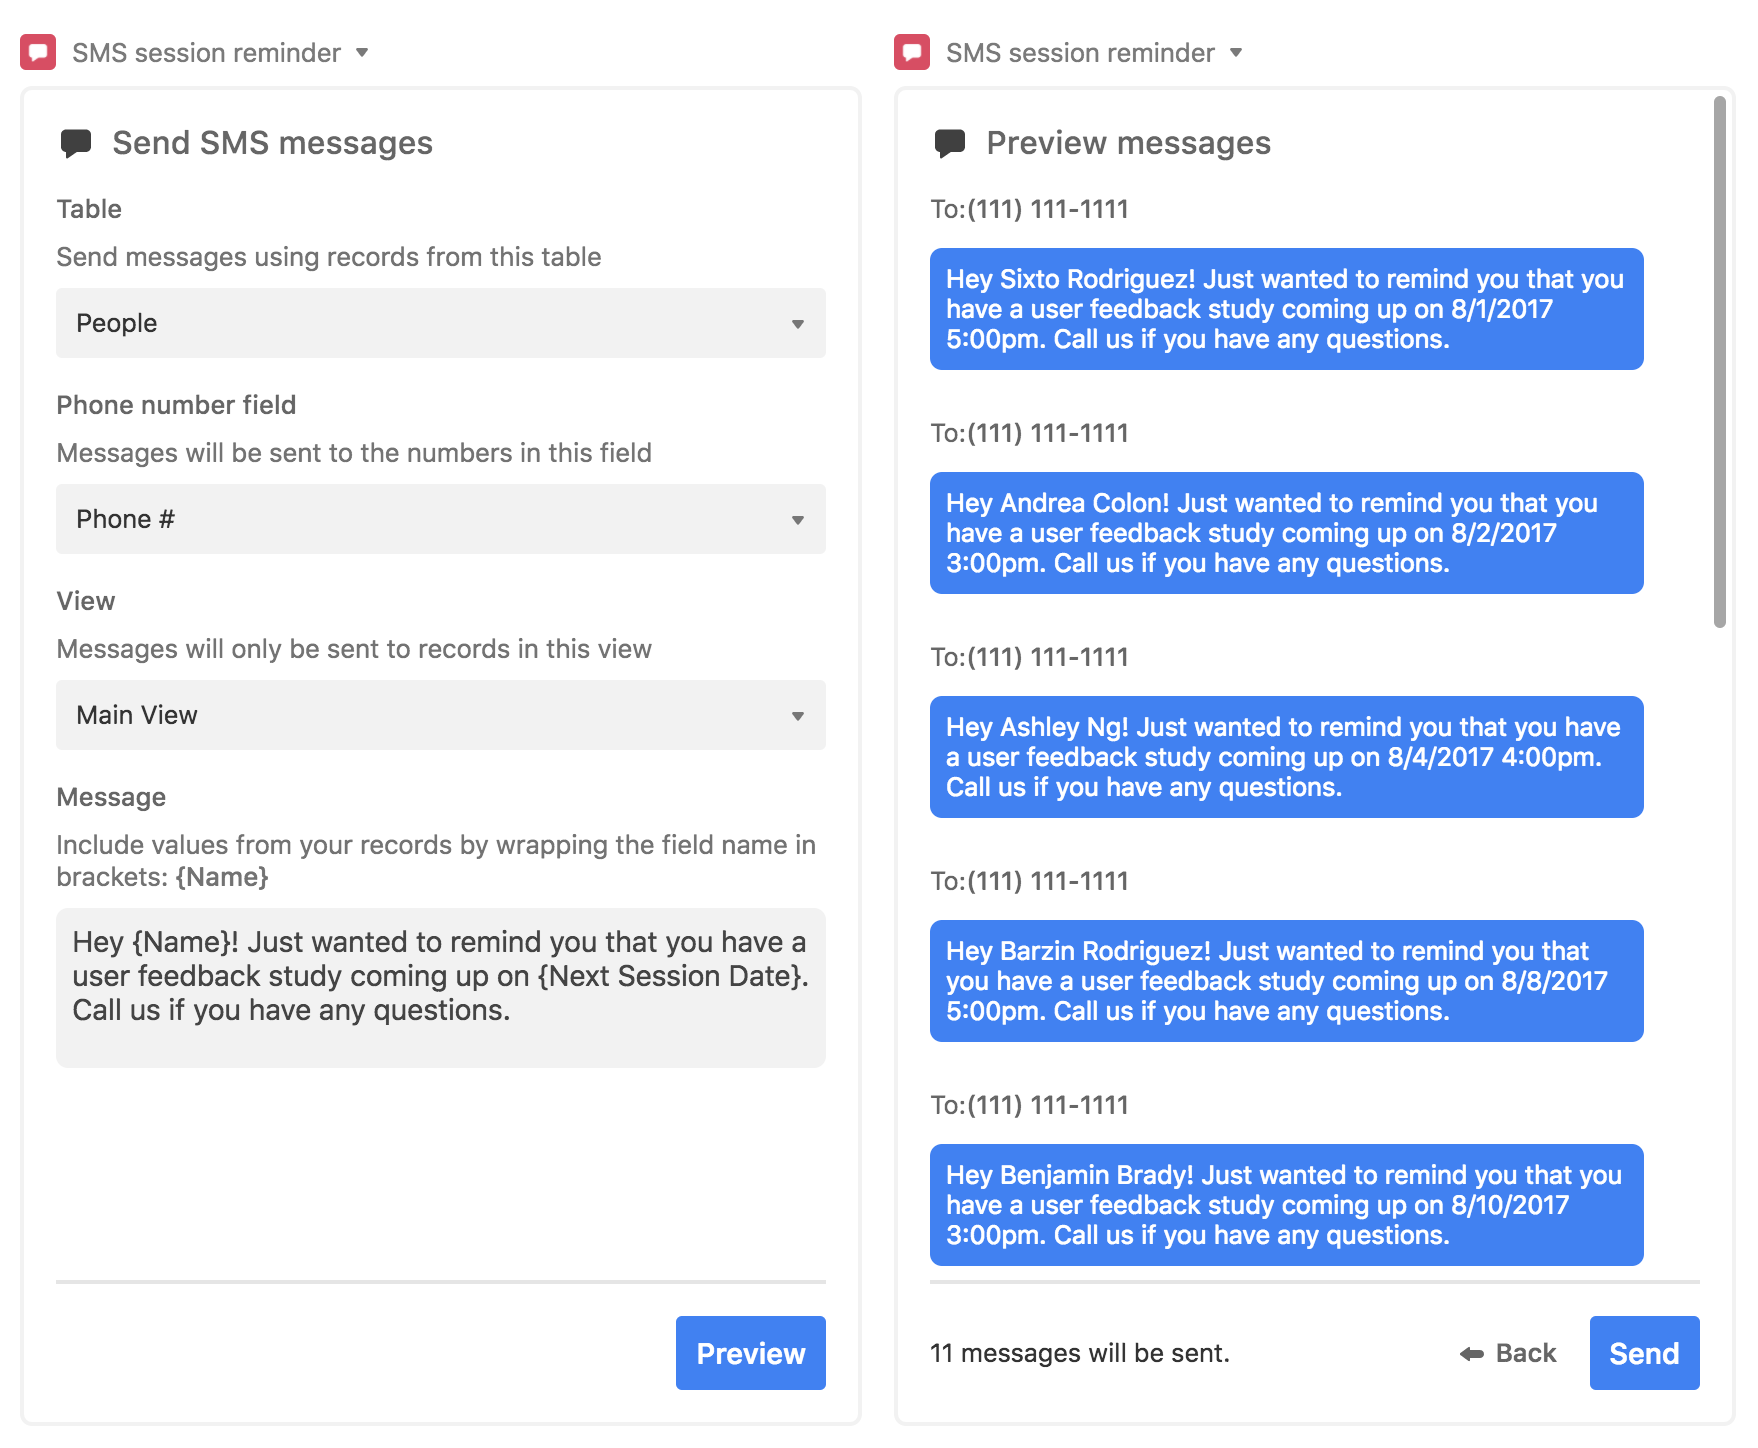
Put the send SMS app to work by sending each of your session participants a reminder with one click.
Step 1: Add a send SMS app to your base.
Note that you'll also need a Twilio API key in order to use this app. To add a send SMS app, just open up the apps menu, click the add an app option, and add a new send SMS app to your base.
Go through the setup process, picking a table and view that host upcoming session dates and the contact info of the users involved, and entering your Twilio API key.
Step 2: Compose your message.
Then compose a message that you want to send. Remember that you can use curly brackets to take information from fields and put it into your message.
Step 3: Send out the message.
The next time you've got a batch of upcoming user sessions, hit the send button and participants will get a quick reminder of your session details.
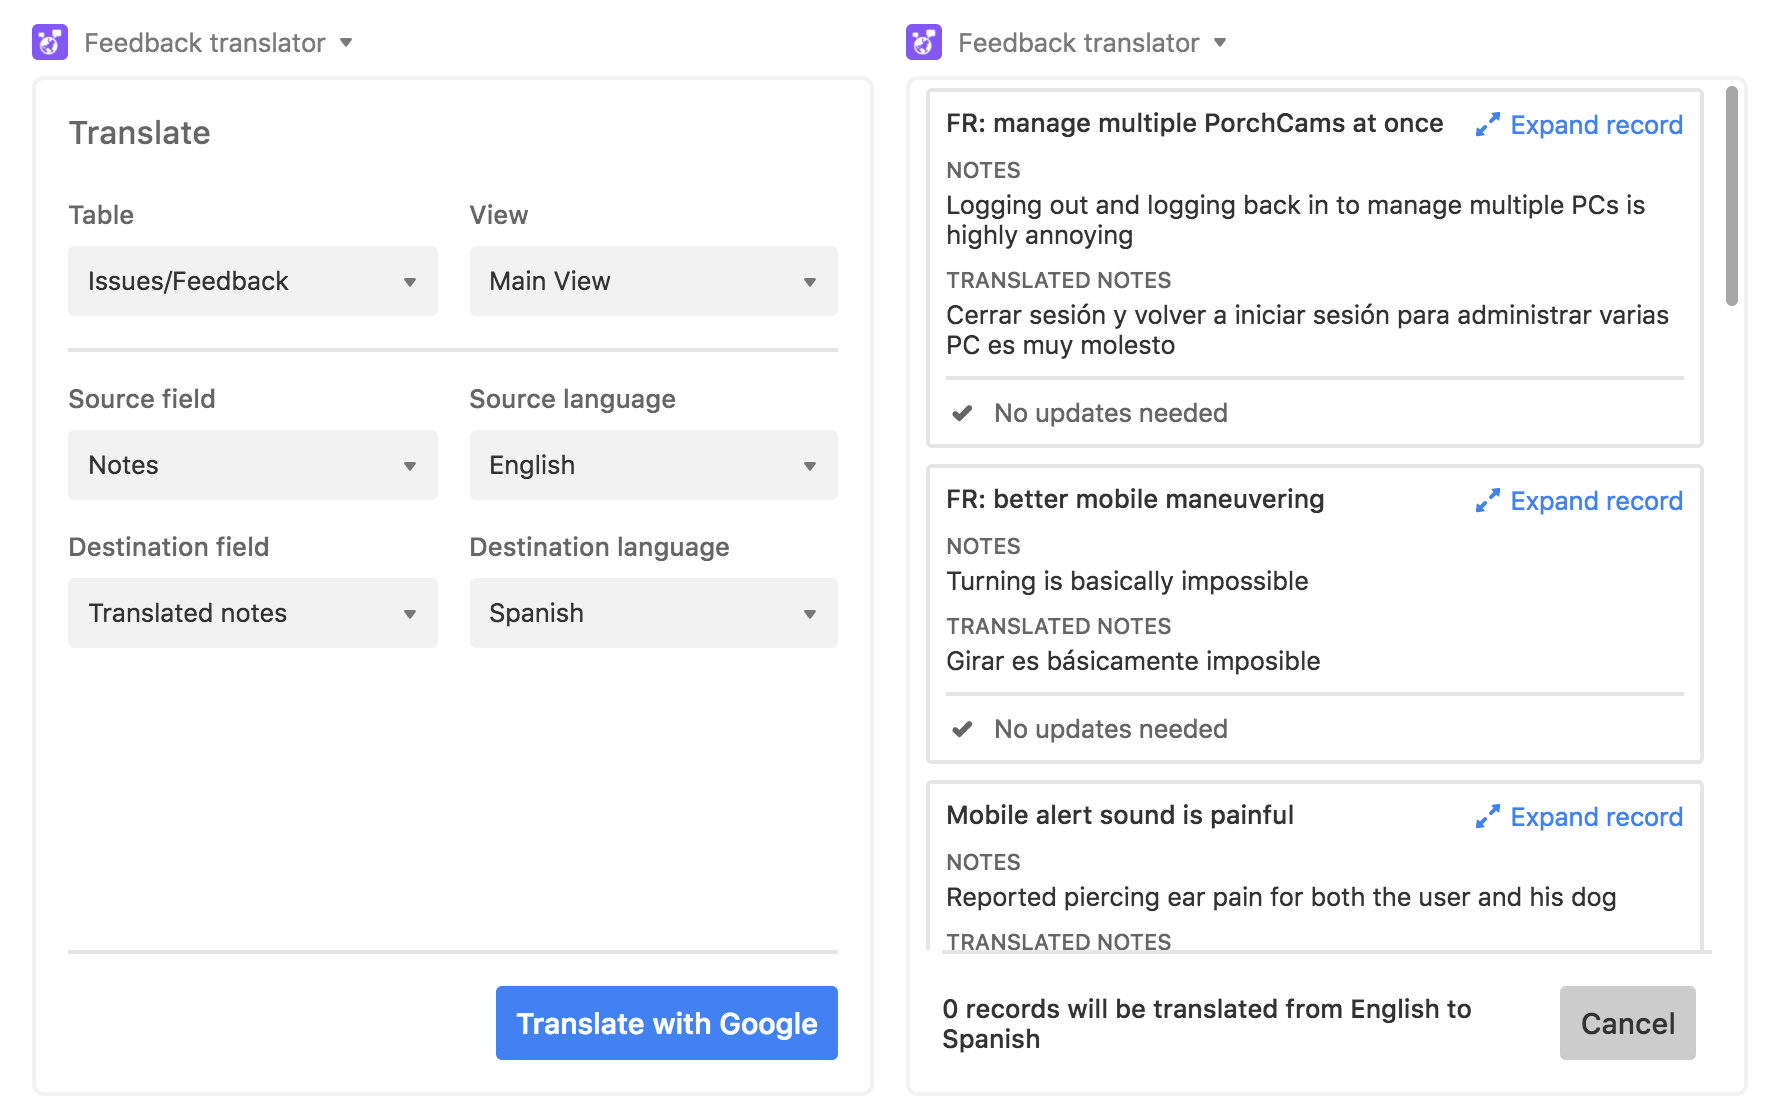
With the translate app, you can put the feedback you're capturing into another language without ever leaving your base.
Step 1: Make sure you have a field to host your translations.
In the table holding the user feedback you want to translate, add a long text field that can hold translations once they're completed.
Step 2: Add a translate app to your base.
Note that you'll also need a Google Cloud Translate API key to use this app. Choose the add an app option from the apps menu, and add a translate app to your base. You'll be prompted to enter your Google Cloud Translate API key.
Step 3: Translate your feedback.
Choose the table, view, source field, and current language of your feedback, and select the new field you created where you want the translation to be entered. Then pick the language you want to translate to, and click the translate button to instantly see the results in your base.
Analyze feedback and pain points in real time
You've done the important work of capturing issues and feature requests from your users—now it's time to glean some insights. The record list app and pivot table app can highlight the topics your users mention most frequently and track their reactions to different studies.
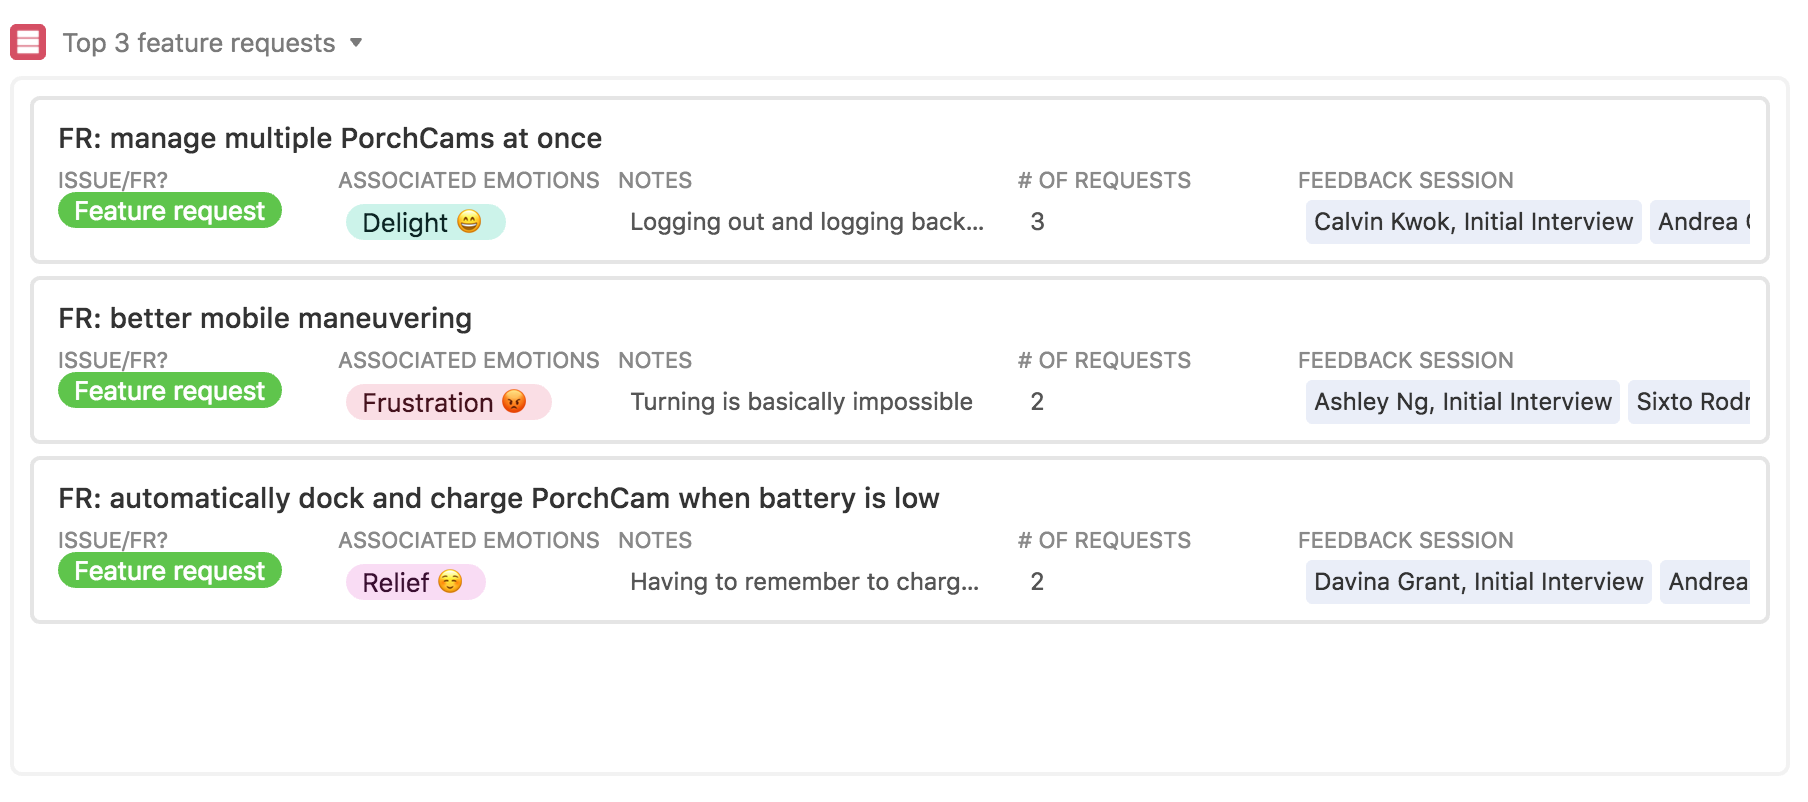
Have the record list app populate a running list of common issues and most-requested features.
Step 1: Create a table for user requests.
Make a table that holds reported issues and requested features captured across your testing sessions. Add a field that counts the number of users who've mentioned a specific feature or issue.
Step 2: Add a record list app.
Next, choose the add a app option from the apps menu, and add a record list app to your base.
Step 3: Configure the record list app.
From the dropdown menu in the record list app's settings, select the appropriate table and the view you created in Step 1. Then, sort the records by the number of requests, and limit to your preferred number to focus on (above, the top 3 feature requests are displayed).
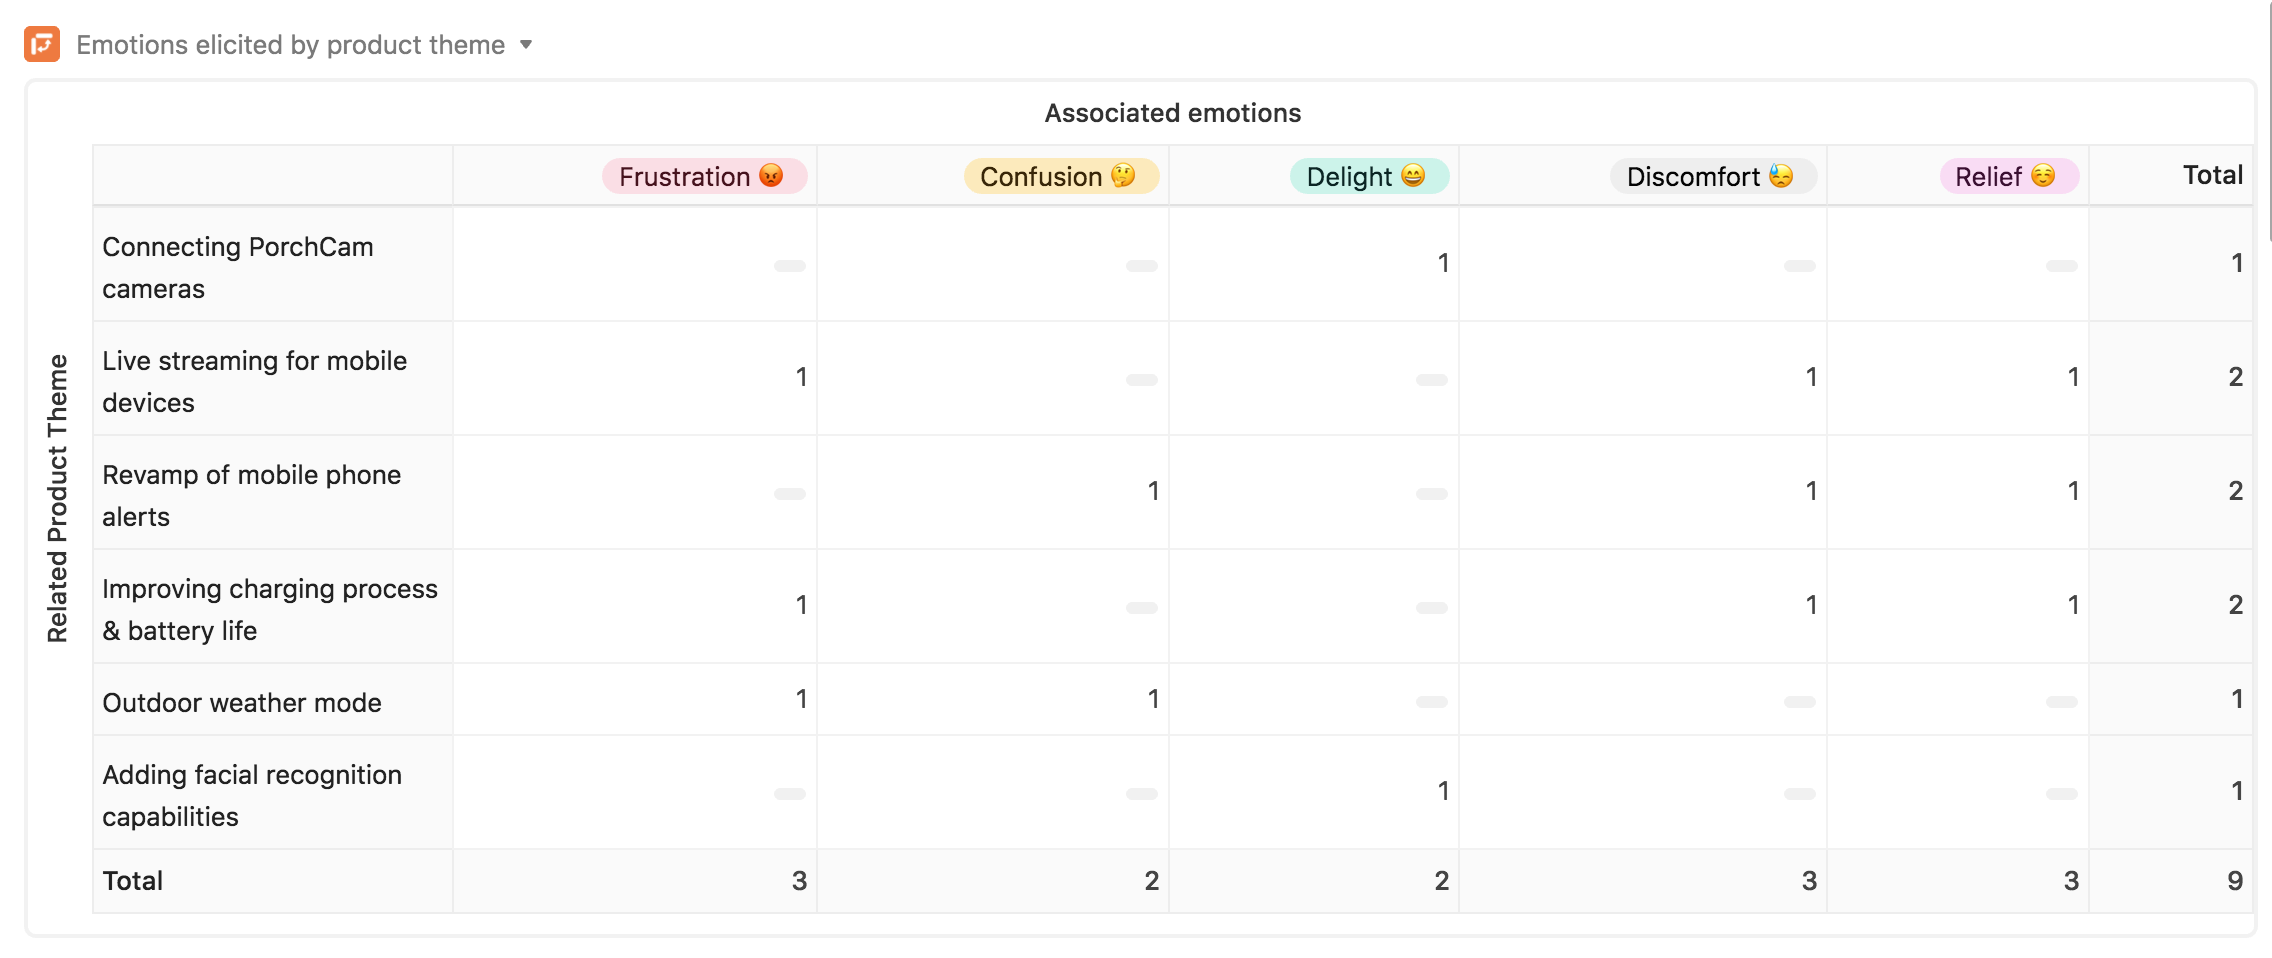
Use the pivot table app to display the user emotions triggered by different product workflows.
Step 1: Add user reactions to your requests and issues table.
Make sure your requests table includes a field where you can note emotions reported by users during each study.
Step 2: Add a pivot table app.
Open up the apps menu, click the add a app option, and add a pivot table app to your base. You can select the relevant table in the first field of the app's settings page.
Step 3: Customize the table for your needs.
Choose the row and column groupings that you want to analyze. Above, the X axis shows workflows tested by users, and the Y axis indicates emotions reported by users. (Tip: if you have multiple emotions associated to one study, try toggling the split multiple values option to get a cleaner look at each one.)
Anticipate—or push back—your next launch
Deadlines are good at sneaking up on you—and so are last-minute roadblocks that impact feature timing. The countdown app keeps your next launch date front and center, and the batch update app can easily edit upcoming release dates when timing shifts.
When you're in that crunch, being able to quickly estimate team bandwidth is key to getting all hands on deck. The chart app can give you a quick look into current capacity across project leads.
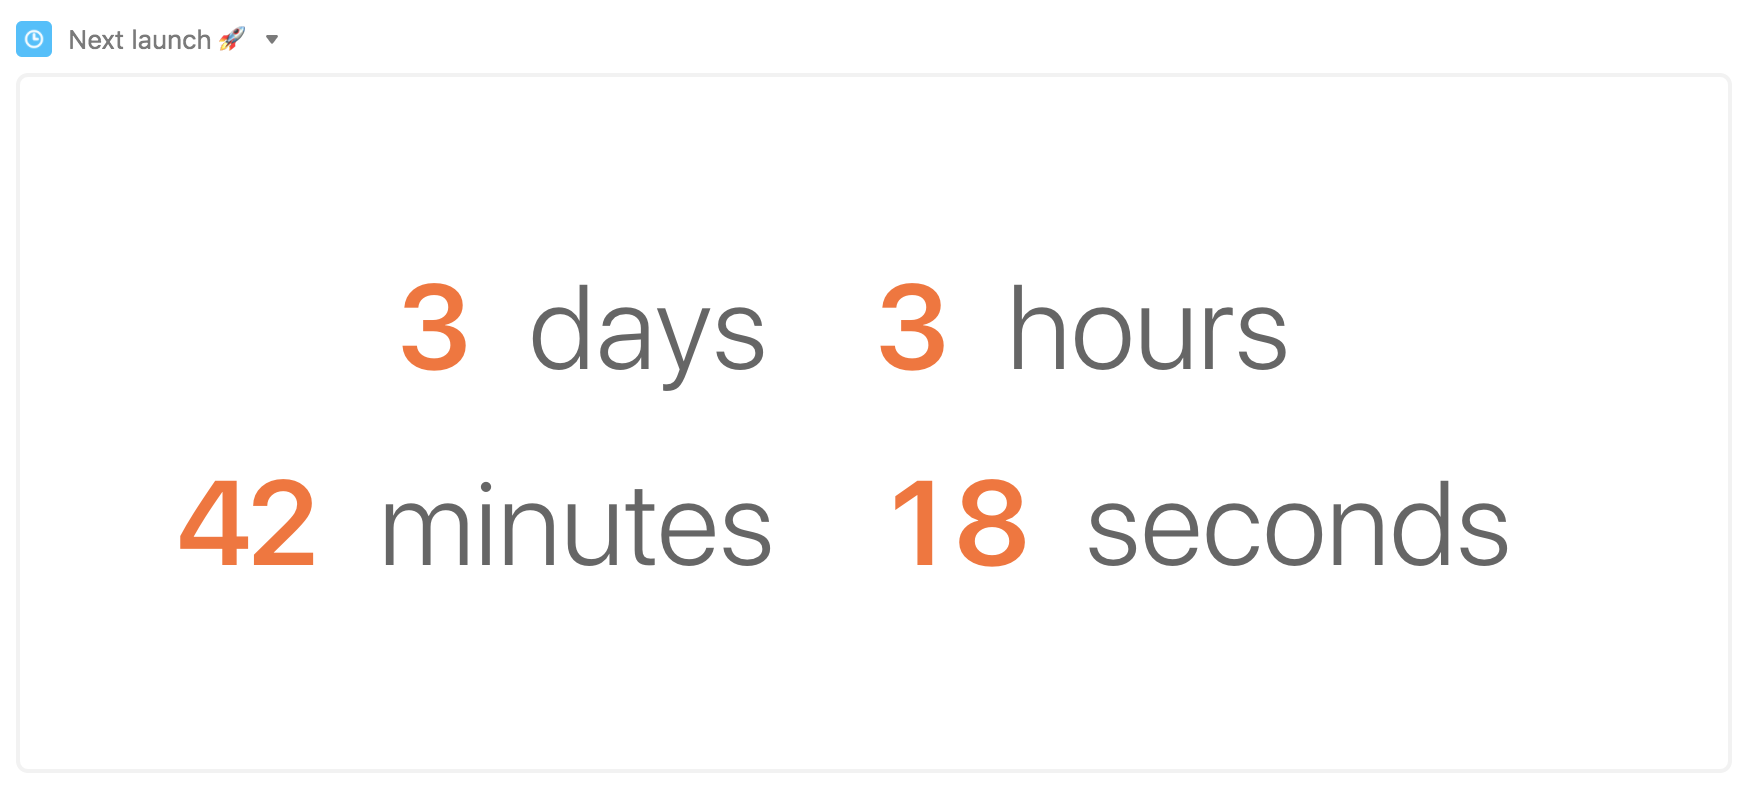
Sync the countdown app to your next launch date and tick off the days, hours, and minutes in real time.
Step 1: Create a view of unlaunched features.
Make sure you have a view in your feature table that's filtered to only show features that haven't been launched yet.
Step 2: Add a countdown app.
Open the apps menu and select the add an app option. From here, add a countdown app to your base.
Step 3: Choose the dates you want to track.
Toggle the Date from view option and select the view with unlaunched features. Make sure Earliest date is selected and check off the units you'd like to track.
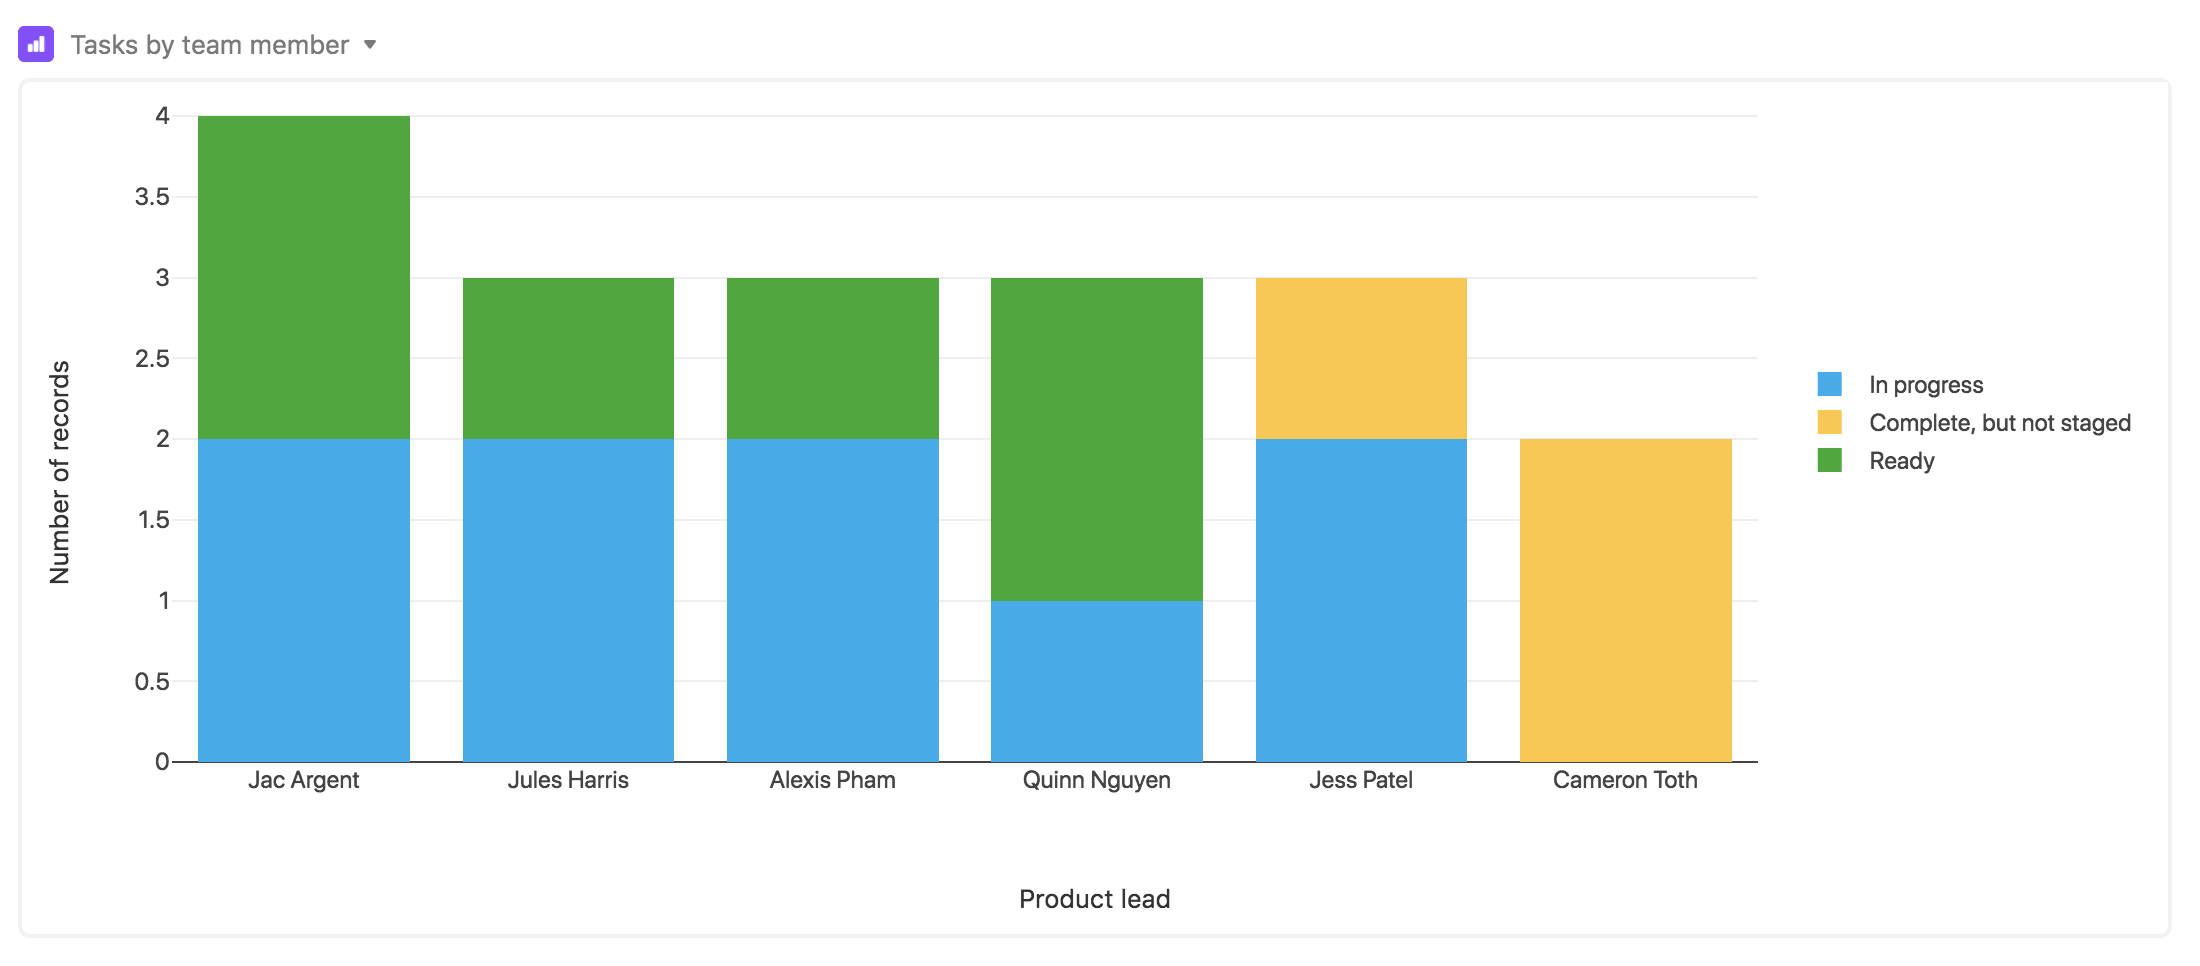
Use the chart app to visualize work items by team member and current status.
Step 1: Add a chart app to your base.
Open up the apps menu, click the add an app option, and add a new chart app to your base. With the chart app, you can make a bar chart, a line graph, or a scatter plot.
Step 2: Adjust the chart app to fit your needs.
Once you've added the chart app, you can tweak the settings to match your needs. Of these three types of graphs, a bar chart is best suited to comparing between different groups, so we suggest a bar chart for comparing projects across team members. But of course, you can pick whichever type you want.
If you're doing a bar chart, we recommend that the X-axis be the name of the project, while the Y-axis should be the project lead. You can also group by project status to quickly see how many items are completed across team members.
(Tip: you can click on a segment of the chart to see which records are being referenced, and click into those records for more context.)
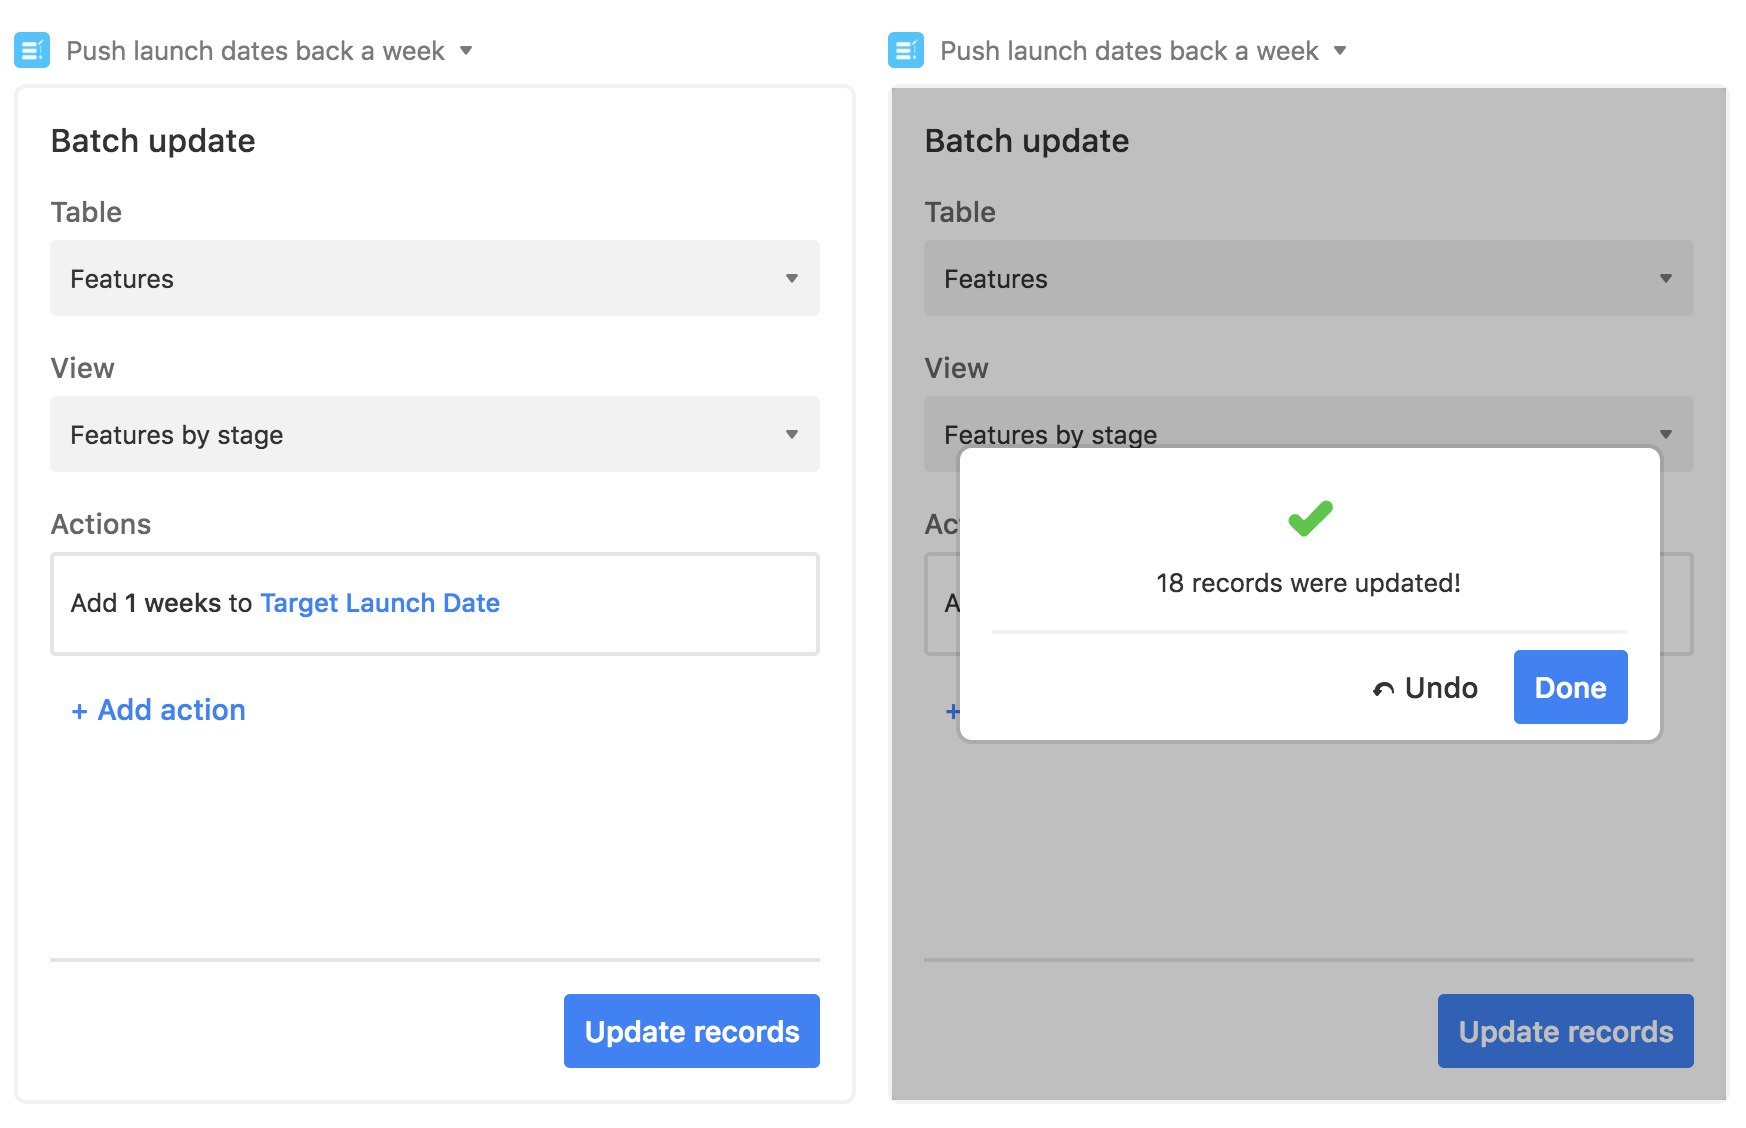
The batch update app can push dates back or forward in bulk with the click of a button.
Step 1: Choose a set of records and make a view.
Create a filtered view that contains only the records you'd like to edit as a group. You might choose all launch dates in the future, for example, or only launch dates associated to a specific initiative.
Step 2: Add a batch update app.
Go to the apps menu and select the add an app option, then add a batch update app to your base. Then select the table and filtered view that you just set up.
Step 3: Set up editing rules.
You can specify one or multiple actions you want to trigger with a single click. Select the field you want to update and the action you want to take. In the example above, one week will be added to the launch date for every feature in the specified view.