In order to make the best use of your team's limited time and resources, you need to master the art of effective prioritization. Of course, that's easier said than done—looking at the big picture can be difficult when you have a large number of opportunities to choose from and a ton of stakeholders, all of whom want different things.
A matrix is a simple product management tool you can use to visualize each potential feature in the context of all the other potential features you could develop. If you're already managing lists of feature requests and user stories in Airtable, the latest addition to the Airtable Blocks platform—the matrix block—allows you to automatically create a prioritization matrix from your existing information.
There are many different kinds of prioritization matrices, each optimized for different purposes. Today, we'll focus on a few of the most popular types of prioritization matrices for product planning: the value-complexity matrix, the value-risk matrix, and agile user story mapping.
Value-complexity matrix
One of the most intuitive and straightforward methods for prioritizing your product roadmap is categorizing potential new features by their expected business value and implementation complexity.
“Business value” can include any of a number of different concepts depending on your company's overall strategic objectives: how useful a given feature will be for customers, employees, or suppliers; the ability of a new feature to generate more revenue, traffic, or publicity; or the positive impact the new feature might have on the product's performance, security, and reliability. “Implementation complexity” is a similarly broad category, encompassing how much time it will take for a feature to be implemented, how technically challenging it is to implement that feature, and how much it will cost to develop that feature—to name just a few examples.
The simplest type of value-complexity matrix is a 2x2 grid of quadrants: the value for a given project can be either low or high, and the complexity for a given project can be either low or high. To make this sort of matrix for your own team, start from a table of feature requests or potential new features, and make two single select fields for value and complexity.
Next, add a matrix block to your base. After selecting the appropriate table and view, pick the Value field to define your rows and the Complexity field to define your columns.

High-value, low-complexity items can be considered “easy wins” or “low-hanging fruit” and should definitely be considered for your product roadmap. However, a common pitfall is to only prioritize these features, at the expense of your high-value, high-complexity features.
High-value, high-complexity items are typically larger strategic initiatives that will require a lot of effort and time—but will ultimately be worth the hard work and pay enormous dividends in the long run. One way to approach these features might be to consider whether it's possible to break them down into simpler, less complex tasks.
Low-value, low-complexity items might or might not be worth your time eventually, but definitely should not prioritized above your high-value features. You can always revisit these features in a later development cycle or consider alternate approaches that might make them higher value.
Low-value, high-complexity items should be deprioritized or reconsidered altogether.

Value-risk matrix
The value-risk matrix is an alternative to the value-complexity matrix that also categorizes potential projects by their expected business value—but (as you might expect) it categorizes them by how risky they would be to implement, rather than by how complex they would be to implement.
Risk is inherent in product development: there might be uncertainty about your estimates for how long a feature might take to complete or how much it might cost, uncertainty about your team's ability to execute on the feature, or uncertainty about how much executive support a project might receive. The value-risk matrix is especially useful when you're less certain about your underlying assumptions—meaning that it's a particularly useful framework when you're building out entirely new products or initiatives.
The simplest type of value-risk matrix is a 2x2 grid of quadrants: the value for a given project can be either low or high, and the risk for a given project can be either low or high. To make this sort of matrix for your own team, start from a table of potential new features, products, opportunities, or initiatives, and make two single select fields for value and risk.
Next, add a matrix block to your base. After selecting the appropriate table and view, pick the Value field to define your rows and the Risk field to define your columns.

In general, high-value, low-risk items should be prioritized.
High-value, high-risk items should be carefully considered before investing time and effort—but at the same time, depending on your team's circumstances and risk tolerance, you might want to prioritize some of these items above some of the high-value, low-risk items.
It is often the case that high-value, high-risk items will have a much greater impact on the product as a whole than the high-value, low-risk items will. Avoiding risky items entirely might lead to a situation in which you build out a large portion of your product before ultimately hitting a wall. On the other hand, pursuing risky items can cause you to waste a ton of time developing a feature that you never end up using. Use your most careful judgment here: when and how often you should pursue high-value, high-risk items depends on the nature of your product and your team's risk tolerance.
Low-value, low-risk items might be worth your time eventually, but should prioritized below any high-value features.
Low-value, high-risk items are not a good use of your team's time and effort and should be avoided.

User story mapping
The previous two techniques are very much internally oriented toward the needs of your product development team. Sometimes, however, you might want to explicitly foreground the customer experience in your analysis instead. User story mapping, developed by product management consultant Jeff Patton in 2005, is one type of prioritization technique that can help you and your team seem how each potential new feature fits into the customer's experience of your product. If you're already on an agile team and comfortable with thinking about your product development in terms of “user stories” and “epics,” this technique should feel fairly intuitive.
A story map is a matrix that you can use to organize your user stories, where the X-axis is the chronological sequence of actions that a user takes as they interact with your product and the Y-axis is an assessment of how important each user story is to the user's overall experience. (If you're not familiar with the concept of user stories, they're basically brief, high-level descriptions of a user's requirements.)
To make a user story map for yourself, start with a table of user stories.
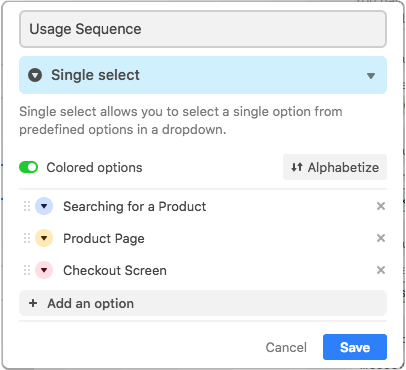
Then, make a single select field called Usage Sequence with dropdown options for each of the steps in your usage sequence. For example, if your product is an online storefront, the activities in your usage sequence might include “searching for a product,” “product page,” and “checkout screen.” This field will be your matrix's X-axis—the one you use to define the columns of the matrix.
Next, make another single select field called Necessity, which you can use to assess how mission-critical each user story is. Following the MoSCoW method, you could make a single select field with dropdown options for “Must have,” “Should have,” “Could have,” and “Won't have,” or you could use a simple rating field instead. Either way, the Necessity field will be your matrix's Y-axis—the one you use to define the rows of the matrix.
Once you've done that, add a matrix block to your base. After selecting the appropriate table and view, define your rows with the Necessity field and your columns with the Usage Sequence field.

Once you've fully mapped out your user's journey and defined different levels of necessity important they are, you can start prioritizing by moving stories between rows. Everything in the topmost row—the must-haves—represents the features necessary to create a minimum viable product that will allow the user to progress through the entire usage sequence successfully. In general, a good rule of thumb is that your releases should include a roughly evenly distributed mixture of stories from each stage in the usage sequence.
You can take this a step further by actually defining which features will be completed for which releases. Try making a table of releases, then use a linked record field to link features to releases. (Generally speaking, the must-have features should be in your earlier releases, with should-haves and could-haves coming after that.) Then, you can make a separate planning matrix in which the rows are specifically defined by the different releases, rather than by their necessity per se.

An array of different methods
These three examples are only scratching the surface of how your team can use matrices. For example, if cash on hand is the most pressing concern for your team, you could adapt the value-complexity matrix to create a value-cost matrix instead. Your team's circumstances and goals will not only inform what should and should not be prioritized, but also how you'll determine what should and should not be prioritized: a tiny startup that needs to launch a minimum viable product as fast as possible before it runs out of money has different needs from a larger team embedded in a established company.
Ultimately, prioritization is more of an art than a science; there no objectively “correct” way to prioritize your roadmap, which is why it's vital to get stakeholders involved in your prioritization discussions. Make sure that your team is taking an active role in defining the process, rather than letting a rigid process define how your team does its work.
Check out these four product roadmap examples and use cases in Airtable.