Real estate professionals know what it means to multitask. While some agents are lucky enough to work for a firm with a marketing professional, it isn’t a given—just as many agents act as their own marketer, in addition to their responsibilities to their clients. Managing the marketing materials, open house dates, campaign statuses, and more for multiple properties is a vital part of the profession regardless of whose job it is, and necessitates a streamlined, dynamic workflow.
Airtable Apps are powerful, flexible tools, offering the dynamism to deliver the information you need in the way your workflow demands it. Centralizing your real estate marketing duties with Airtable will help you create a more efficient and effective marketing workflow, so you can spend less time sweating details and more time selling properties.
Here's your step-by-step plan to get it done:
Customize the perfect flyer
Stay on top of listing deadlines
Quickly update your clients with the latest information
Import listing data from your local MLS to your base
Visualize your monthly leads
Customize the perfect flyer
The page designer app uses data directly from your base to create custom reference sheets. You can print out physical copies, turn them into PDFs, or present them using presentation mode. Use them to build flyers for each of your properties when they hit the market.
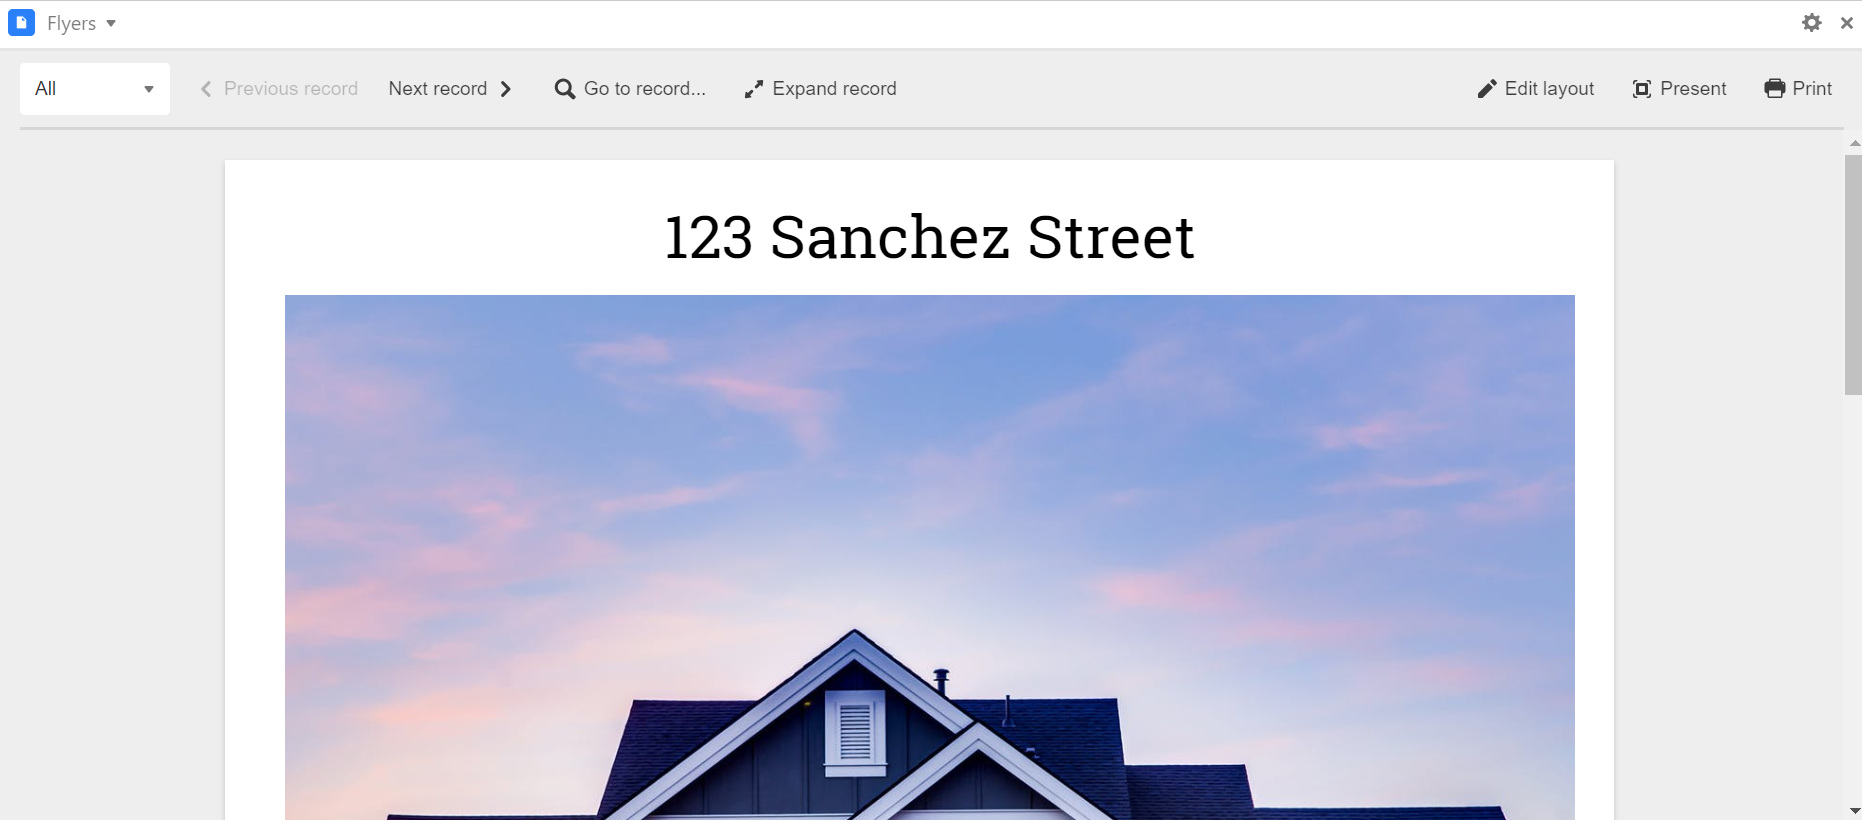
Step 1: Add a page designer app.
Select the add an app option in the apps menu and add a new page designer app to your base. Select the correct table, view, and your preferred page size.
Step 2: Design your template.
Choose the information you want to include on your flyer. You can drag and drop elements from your base onto the page, tweak fonts and colors, and more, so your flyer will look exactly the way you want it to.
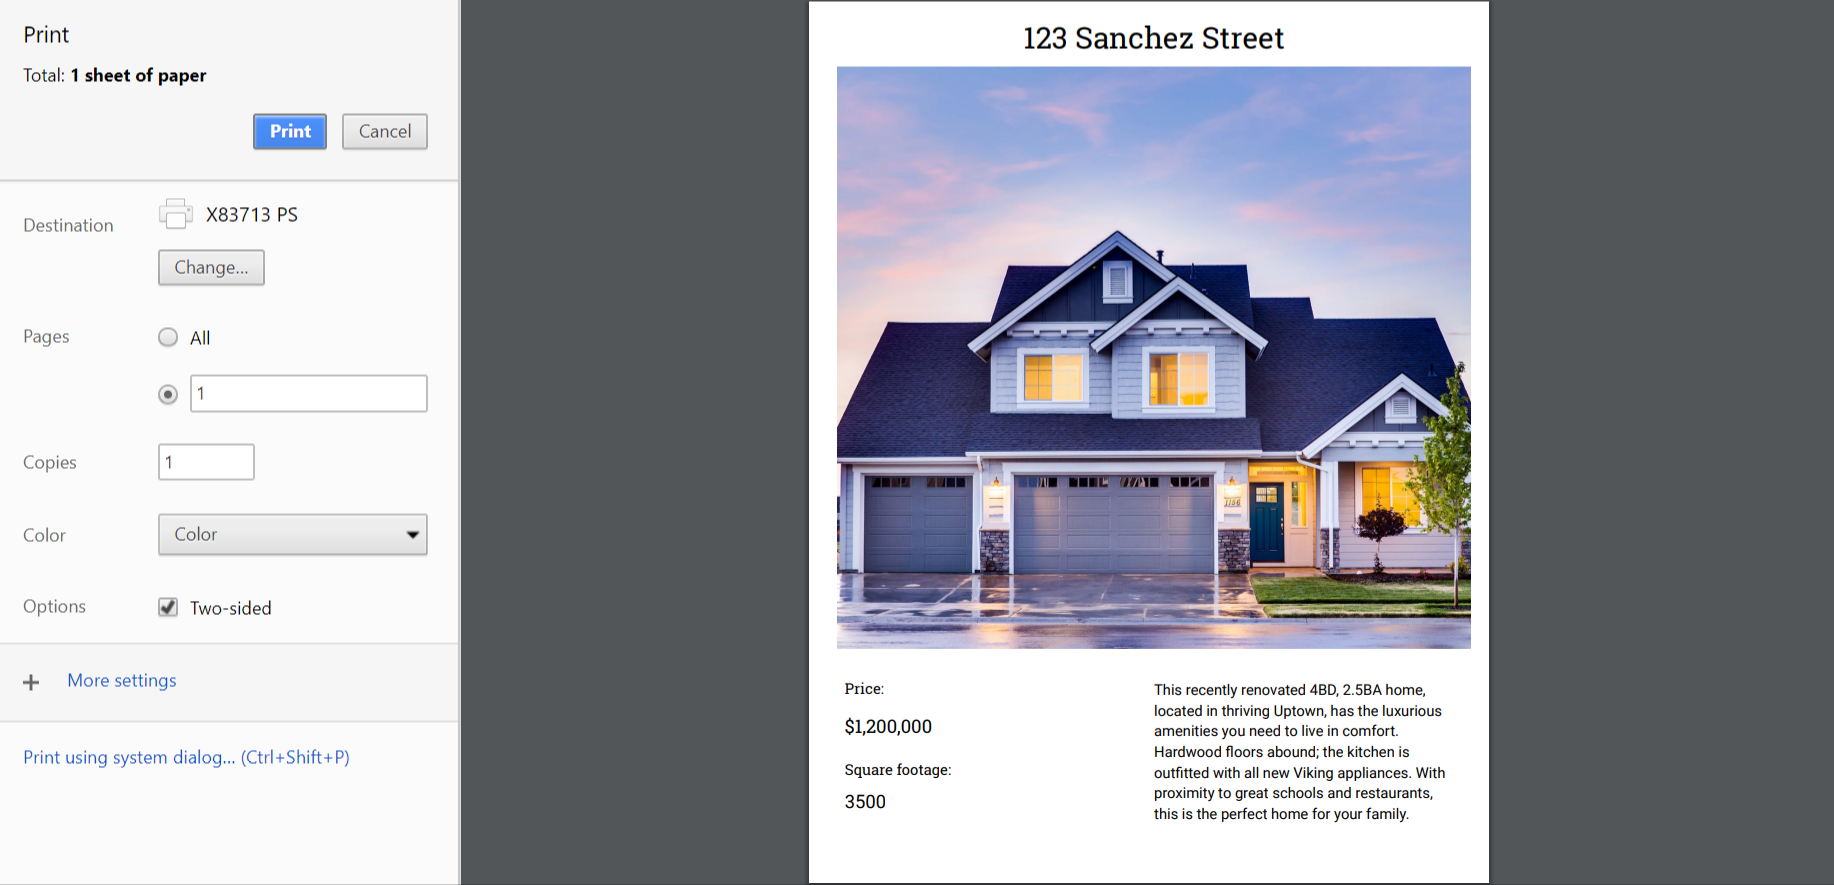
Step 3: Print your lists or export them into a shareable PDF.
Quickly print the sheets when it's time for your next open house, or export and share them as a PDF.
Stay on top of listing deadlines
Property listings don’t follow a single timeline—each one has a variable completion date, launch date, and other details that need to be kept track of simultaneously. A timeline app allows you to visualize your listing run dates alongside each other, so you can stay on top of each listing’s status.
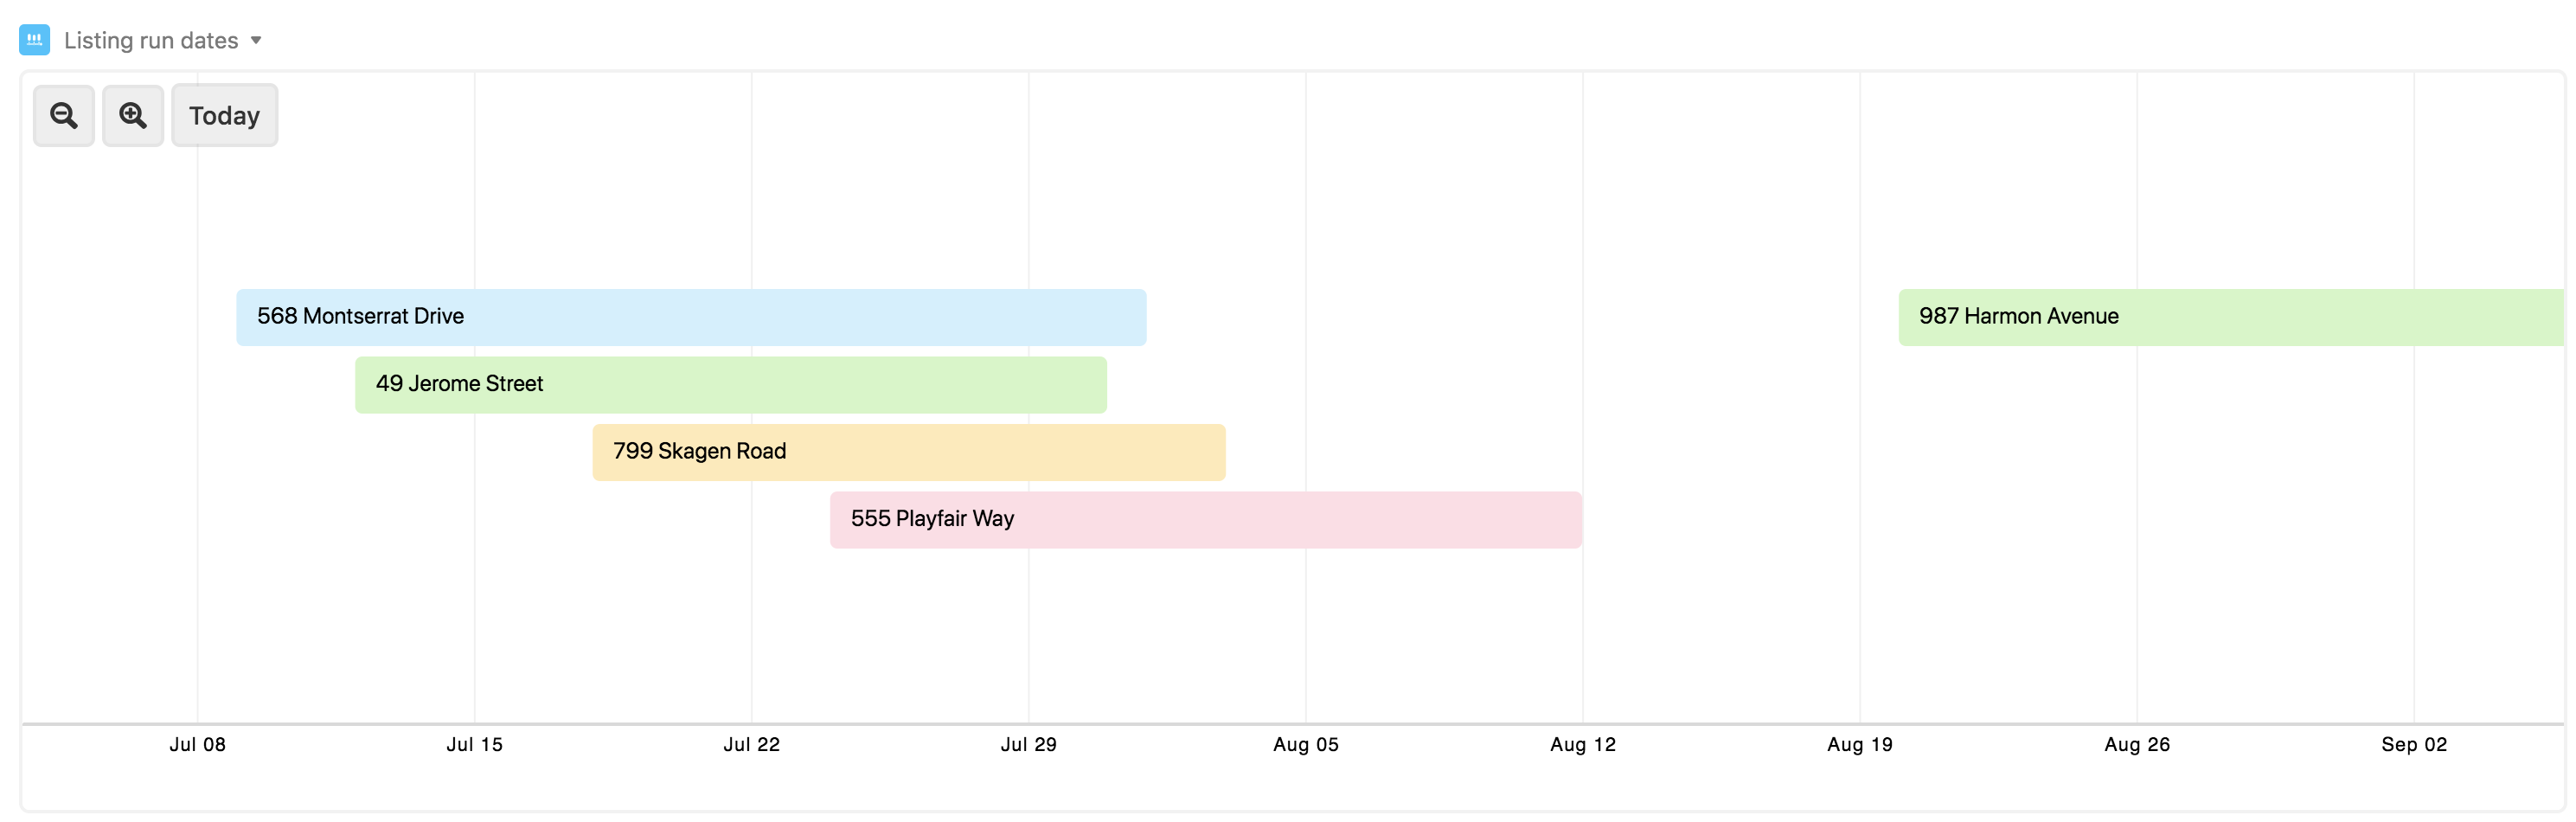
Step 1: Add a timeline app.
Open the apps menu, click the add an app option, and add a timeline app to your base. For this example, we selected Properties as the display table—this contains the most comprehensive information about our listing deadlines. You can select a view that best corresponds to your needs, like a listing launch checklist.
Step 2: Adjust the timeline range and colors.
Choose your preferred start and end date fields—we’ve selected the listing start and listing expiration, respectively. We customized the color of each record by select field (in this case, flyer status) to create an easy visual reference.
Quickly update your clients with the latest information
Real estate markets are dynamic—no matter how informed you are, a new listing, issue, or unexpected sale is always waiting around the corner. The send SMS app allows you to keep your your clients in the loop with the most up-to-date information available.
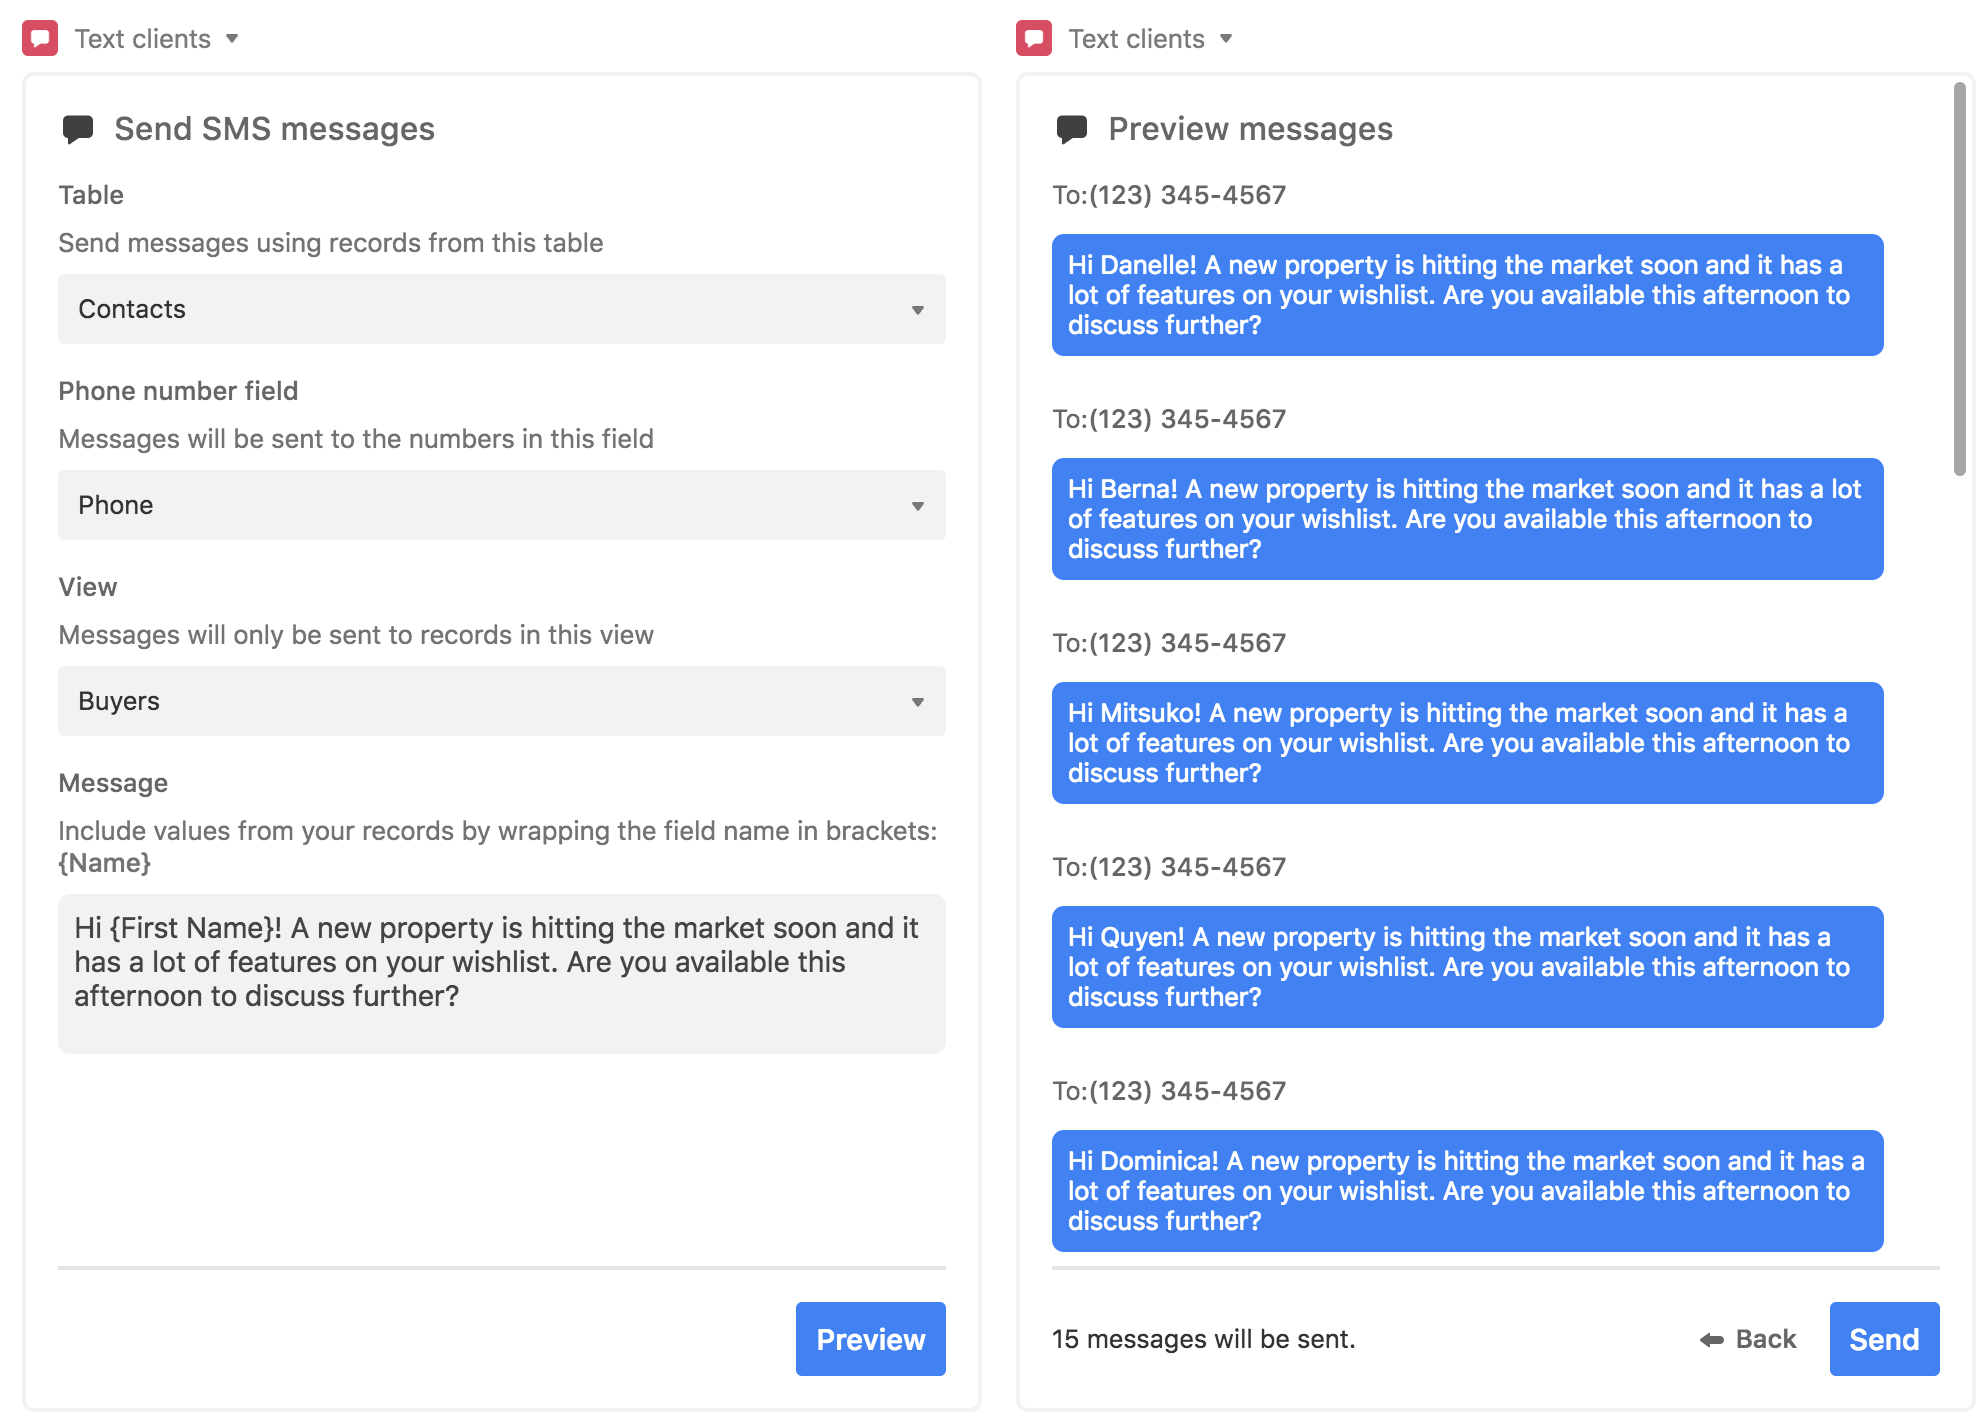
Step 1: Add a send SMS app to your base.
To add a send SMS app, open the apps menu, click the add an app option, and add a new send SMS app to your base. You'll need a Twilio API key to use this app.
After completing the setup process, enter your Twilio API key and other information, then select the appropriate table, view, and phone number field.
Step 2: Compose your message.
Compose a message to send to your clients. Use curly brackets to incorporate information from fields in your base directly into your message.
Step 3: Send the message.
Hit the send button to quickly send a message to multiple clients at once.
Import listing data from your local MLS to your base
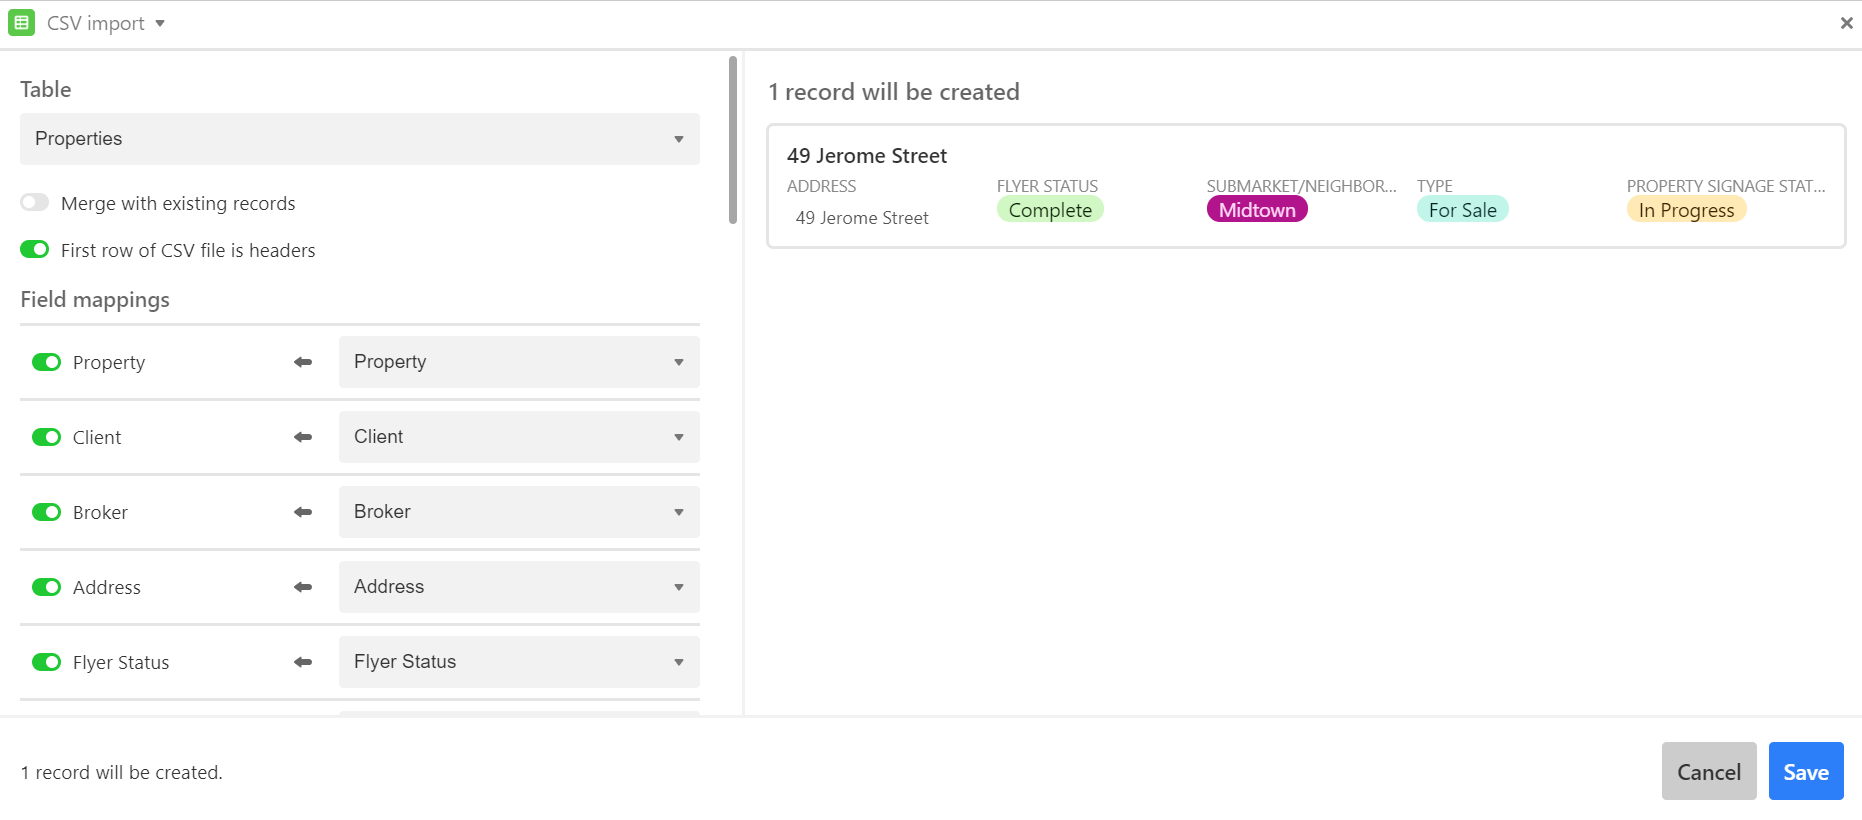
New listings mean new details to track—accuracy and timeliness are key. The CSV import app makes it easy to import new listing data from your local MLS, CoStar, or LoopNet directly into your base.
Step 1: Add a CSV import app to your base.
Open the apps menu, click the add an appp option, and add a CSV import app to your base.
Step 2: Import a CSV file.
Drag and drop a CSV file onto the app to upload it to your base. You can also browse folders to manually select a file.
Step 3: Modify the information for your table.
The CSV import app will try to automatically detect if the first row of your CSV contains headers—it will check the “First row of CSV file is headers” option accordingly. Use the left side of the field mapping section to select which fields to display, and the right side to choose the appropriate columns. The app will try to match these automatically, but you can map the columns to whichever field you like. Once you are ready, click the create records button. The app will remember your field mapping preferences, speeding up your next import.
Visualize your monthly leads
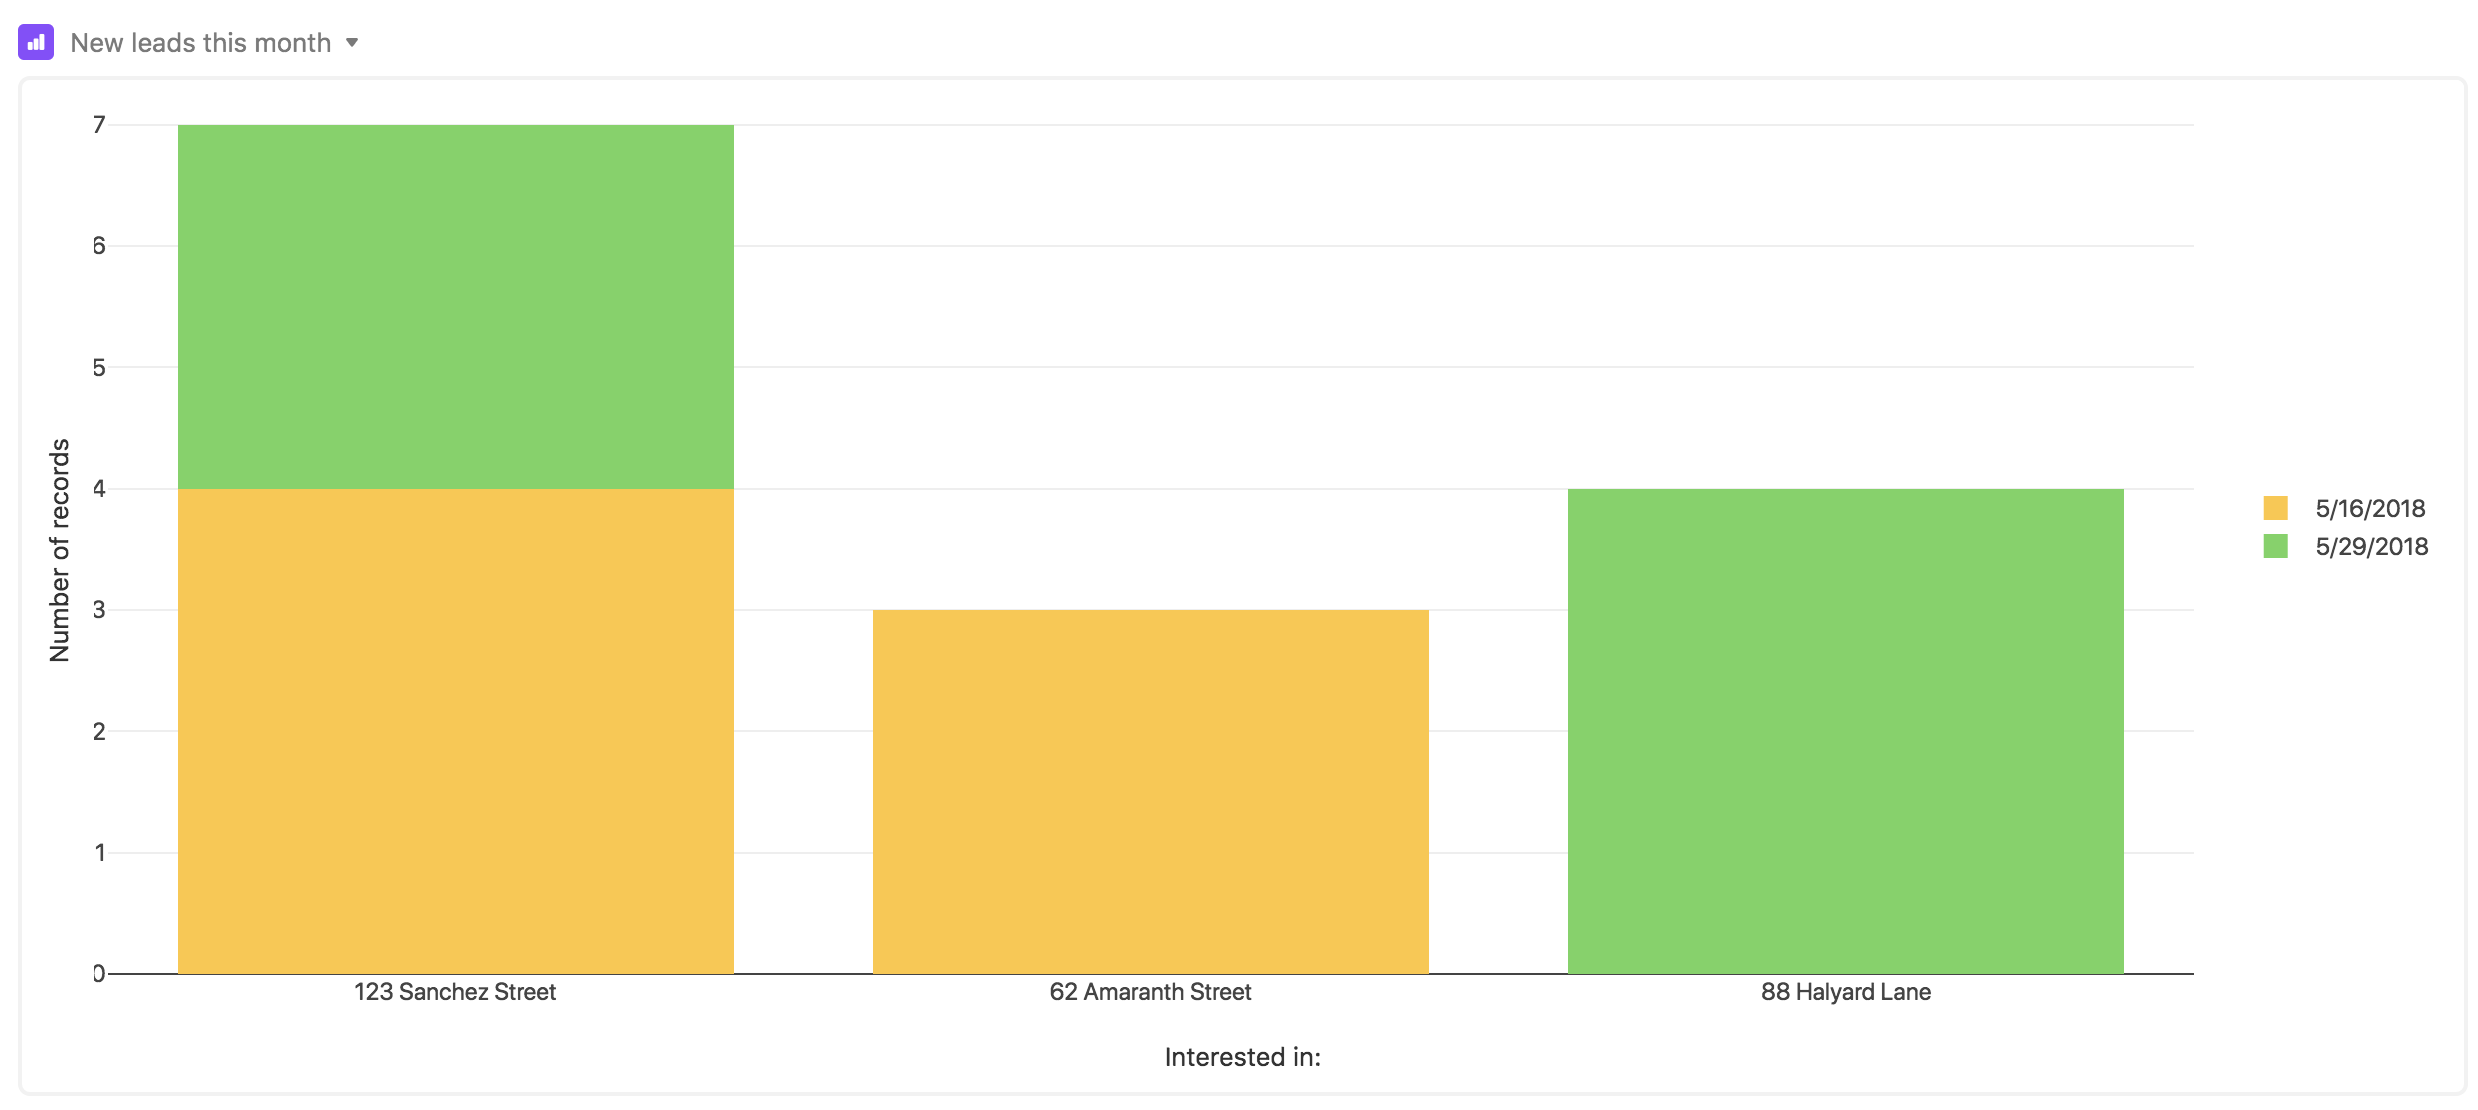
The chart app makes it easy to track and visualize the leads you are generating per month, especially when used in conjunction with a form.
Step 1: Collect sign-ups.
Create a form to collect information from interested buyers at your open houses. Once configured, the form will automatically populate the appropriate fields in your base, saving you valuable time.
Step 2: Add a chart app to your base.
Open the apps menu, click the add a app option, and add a new chart app to your base. You have a choice of three types of charts—a bar chart, a line graph, or a scatter plot.
Step 3: Adjust the chart app to fit your needs.
Chart apps are especially beneficial because of their flexibility. Bar charts are excellent for comparing values, like the number of sign-ups from each open house at a specific property. We used the X-axis to list the properties buyers were interested in, then used the count function to tally and display the number of sign-ups by sign up date. Lastly, we stacked the information for display—hover your cursor over a distinct section for additional data points.