The objective of a growth team is to create growth experiments based on a Build, Measure, and Learn framework. But often times precious time gets swallowed up by minutiae—whether it's running SQL queries to a data warehouse and pasting the results into a spreadsheet, or trying to wrangle together different sources of data from across a company's teams.
The most precious asset for a growth team is time. The more of the data collection, capture, and analysis process that can be automated, the faster you can jump directly to the implementation and put together a process to drive real, sustainable, growth. In this article, we'll take a look at some tricks, tips, and processes that you can use to grow faster.
A 3-step process for growth
When it comes to growth, the most important thing is to figure out how to get more leverage for your time. A three-step growth process might look something like this:
- Setting up experiments and logging data
- Analyzing results and sharing with your team
- Measuring success via key metrics
Within growth teams, these functions are often split off, which means you waste a lot of time trying to connect the dots. Your data around experiments might live in an analytics tool, which then needs to be cleaned and formatted into something that can be shared with your team. You spend time aggregating results from customer feedback and interviews, before you can iterate on the original experiment.
By linking all the data points together, from your early experiment predictions to results, you give yourself more time to actually focus on growth. In this article, we'll walk through how you can put together a basic process for growth, before digging into some of the more advanced ways you can automate that process.
Growth collaboration and experimentation
According to Brian Balfour, founder of Reforge and former VP of Growth at HubSpot, companies trying to engineer growth need to “stop looking for tactics first, and start focusing on establishing a growth process.”
Stop looking for tactics first, and start focusing on establishing a growth process.
When you're trying to move the needle on growth, it's easy to get distracted by the promises of quick wins and one-off growth hacks that will “boost your conversion by X percent.” What you really need to do is limit variability and create a repeatable process—and that starts with building a template for tracking growth experiments.
Put together a basic template for growth
Growth teams need the ability to test, build, and analyze growth experiments so that they can iterate on feedback. To do this, you need to keep track of all experiment ideas, whether they're in the backlog or completed. That's the central nervous system for managing growth at your company.
Let's start with a pretty simple template for managing your growth ideas:
In the Growth Ideas table, we categorize each experiment according to a couple of simple criteria:
- Category: the stage in the customer funnel in which an experiment lives (acquisition, activation, referral, retention)
- Metric: how we're evaluating success for the experiment (i.e. growth in organic traffic, decrease in CPC, etc.)
- Prediction: the estimated impact of an experiment
More than getting a basic experiment view, though, we want to prioritize experiments based on their ability to impact your business' bottom line.
We create a couple more single select fields that help us do this and create a kanban view across:
- Idea Phase
- Priority
Not only does this help us keep track of experiment ideas, but it helps your team put them into action.
Send results to the team
Simply having a dashboard doesn't cut it though—your goal should be to make it easier for anyone on the team to help grow faster. A small growth team might religiously check in on the experimentation base and pipeline, but to grow successfully you have to work cross-functionally with marketing and product teams as well.
Since we did the hard work of structuring the data earlier, it's easy to create an automated monthly email that keeps the whole team updated around growth outcomes—all you have to do is set up an automation with Zapier.
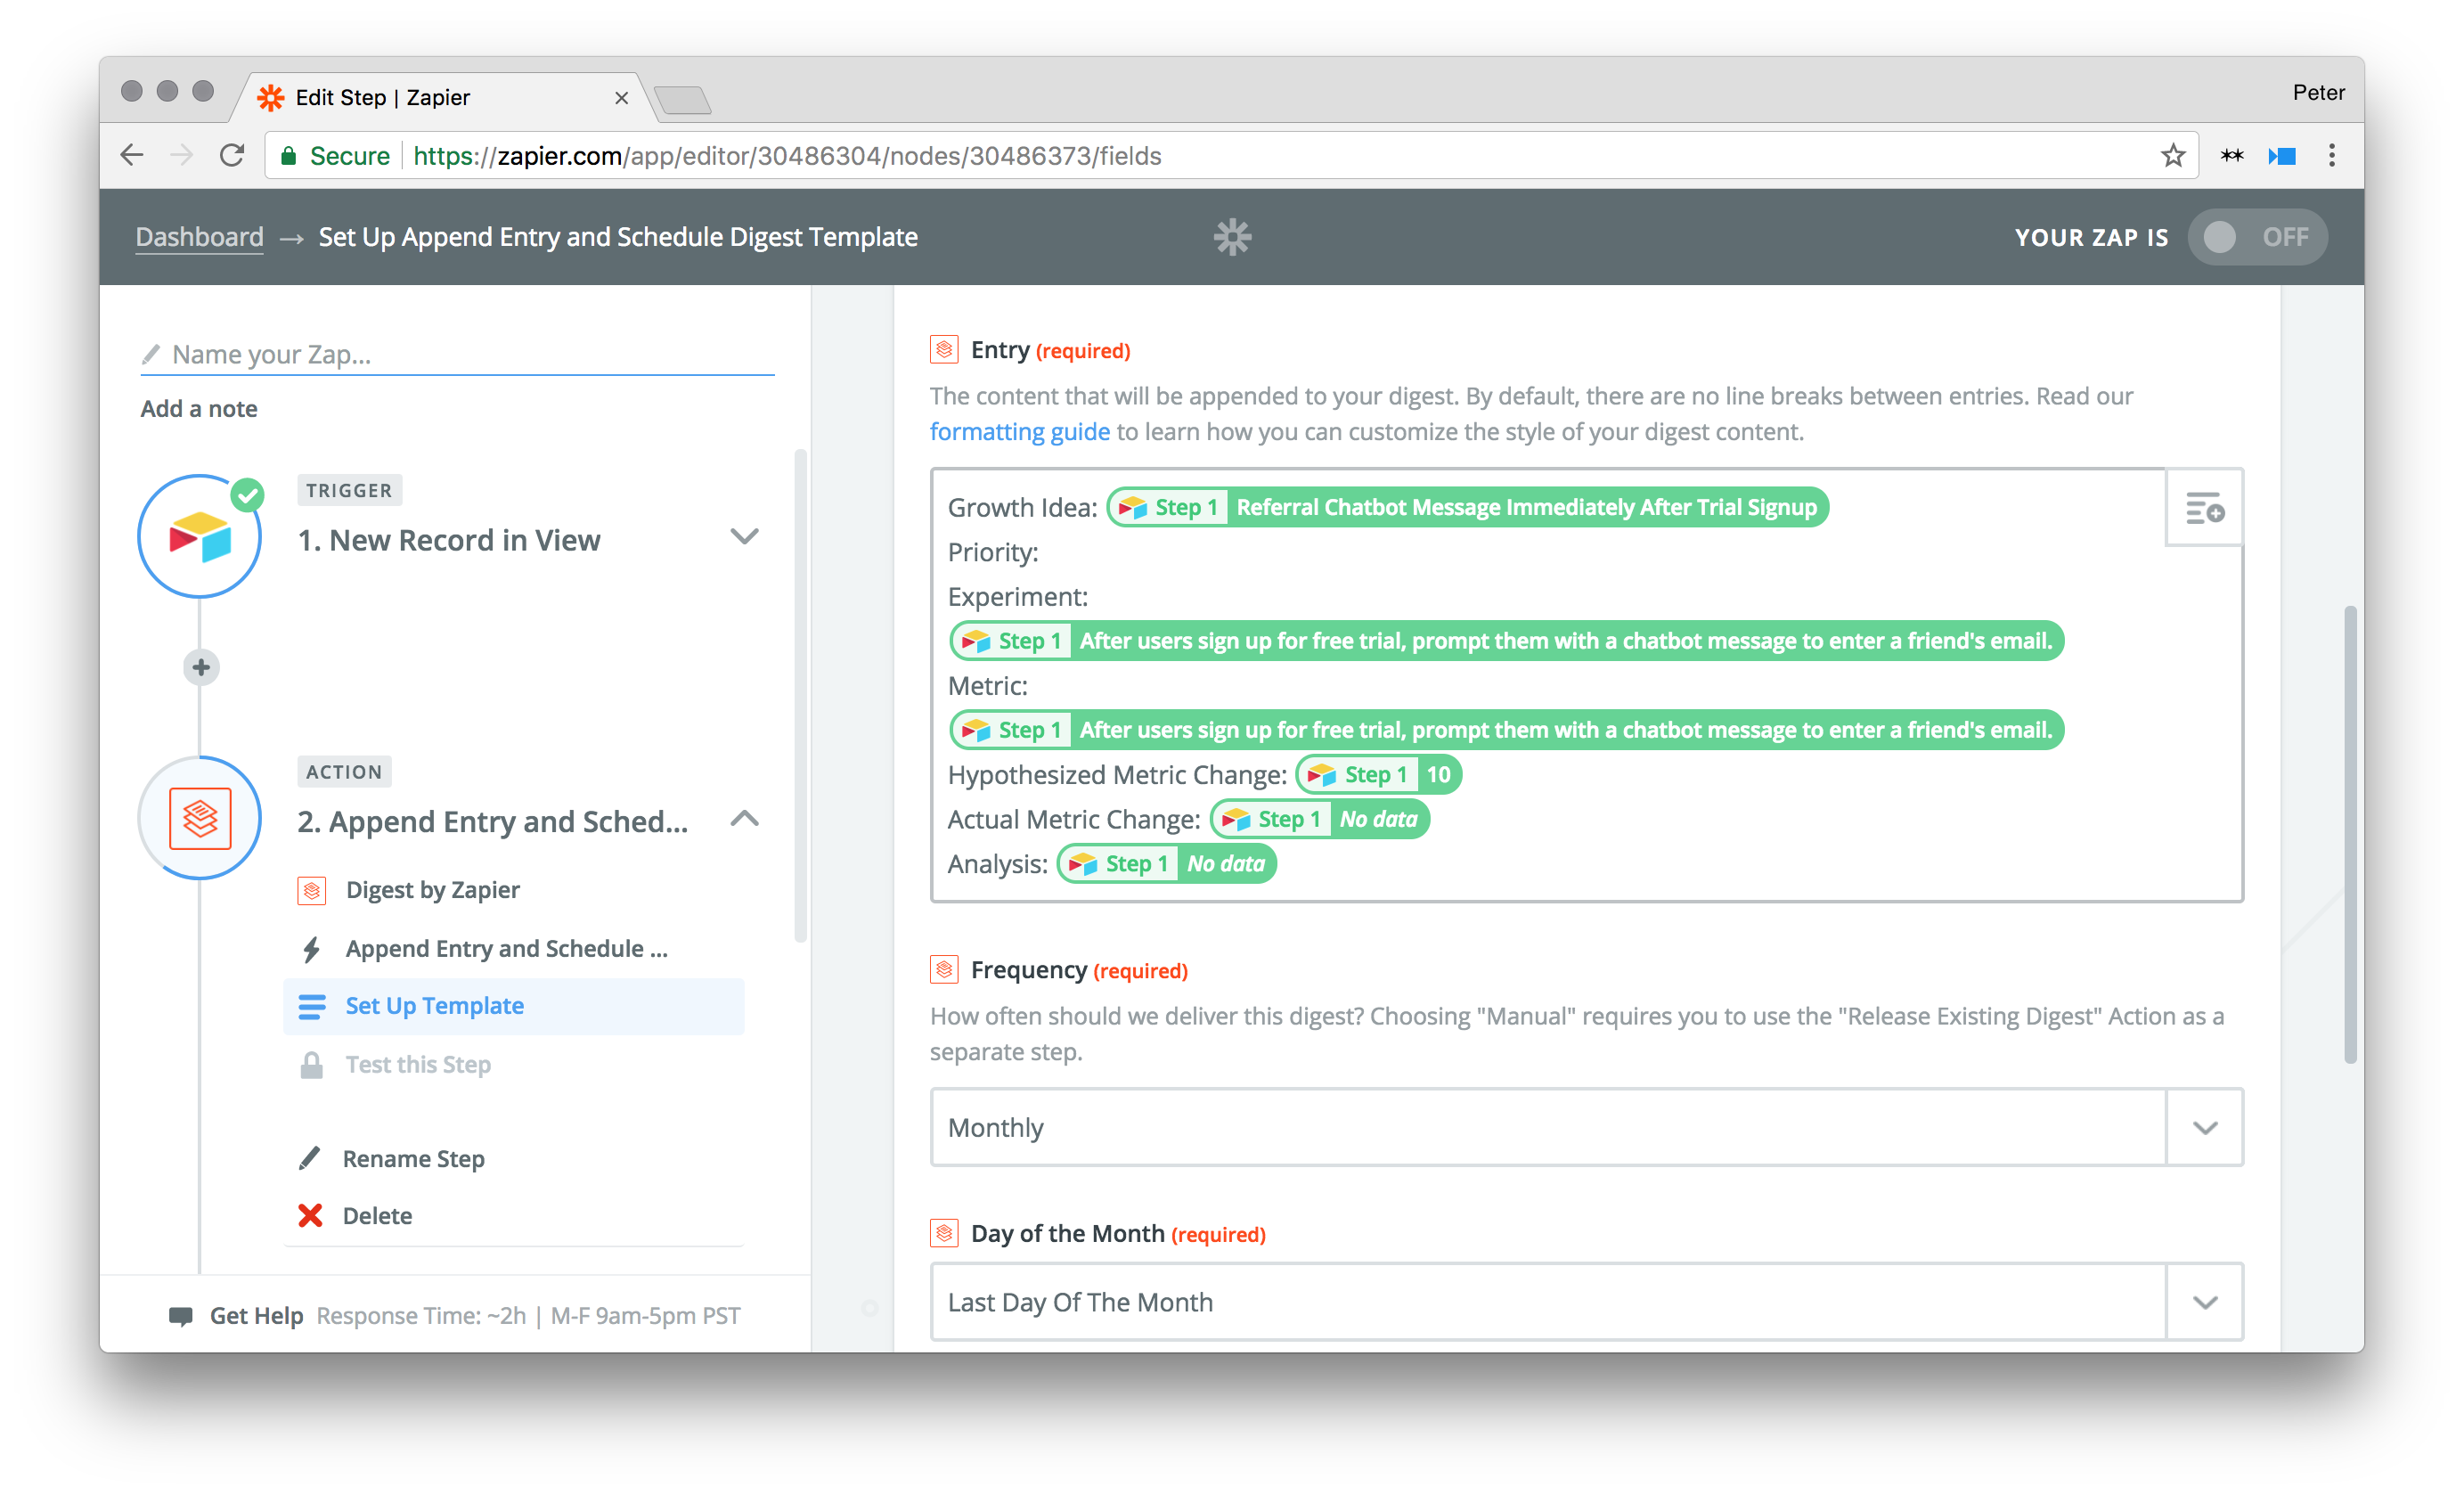
We can create a view in Airtable that shows all completed experiments. Each experiment that's logged as completed triggers a Zap, which adds it to a monthly digest email. On the last day of the month, the digest is automatically sent to the entire team.
Sharing the results of your experiment help you align growth to the other functions of your organization, from sales to product. The less time you have to spend manually logging each experiment and tabulating them into reports, the more time you can spend running actual experiments.
Create an internal dashboard
Beyond just tracking experiments holistically, building repeatable processes around growth means digging deeper and more granularly into the data.
As growth has grown more technical and quantitative, there's been a proportionate explosion in data. Growth teams typically juggle an array of different analytics platforms and tools, from an event-tracking platform like Mixpanel or Amplitude to lifecycle emails and in-app messaging.
Wrangling that data into a centralized dashboard that anyone in the company can access helps you make the process of growth more repeatable and accessible. We'll look at how you can set up dashboards to monitor key growth metrics, as well as more advanced ways you can take pain out of the process.
Draw up retention cohorts
Take behavioral cohort analysis, a way of analyzing user retention.
While you're probably tracking this data, it's typically locked within a specific tool that requires specialized knowledge to navigate. Just because the data exists doesn't mean it's accessible or actionable. When you're trying to get your entire team focused around growing one or two key metrics, surfacing that data is key.
You can export the data from an analytics platform and copy and paste it into an easy-to-read table. Formatting the retention dataset makes it easier to perform your own analysis on the data, giving you the ability to slice and dice it as granularly as you need. The following table is a pretty standard cohort analysis table that shows week over week user retention for a hypothetical product:
Each record shows a cohort of users by the week of sign-up. The fields labeled “Week 0” through “Week 9” horizontally show how many users are still using the product each week. We can see, for example, that by Week 3, 70 out of a cohort of 78 remain.
Once we have this raw user data organized, we can then do a deeper dive into the data. We can create another view that uses a formula field to calculated what percentage of users stick around week over week:
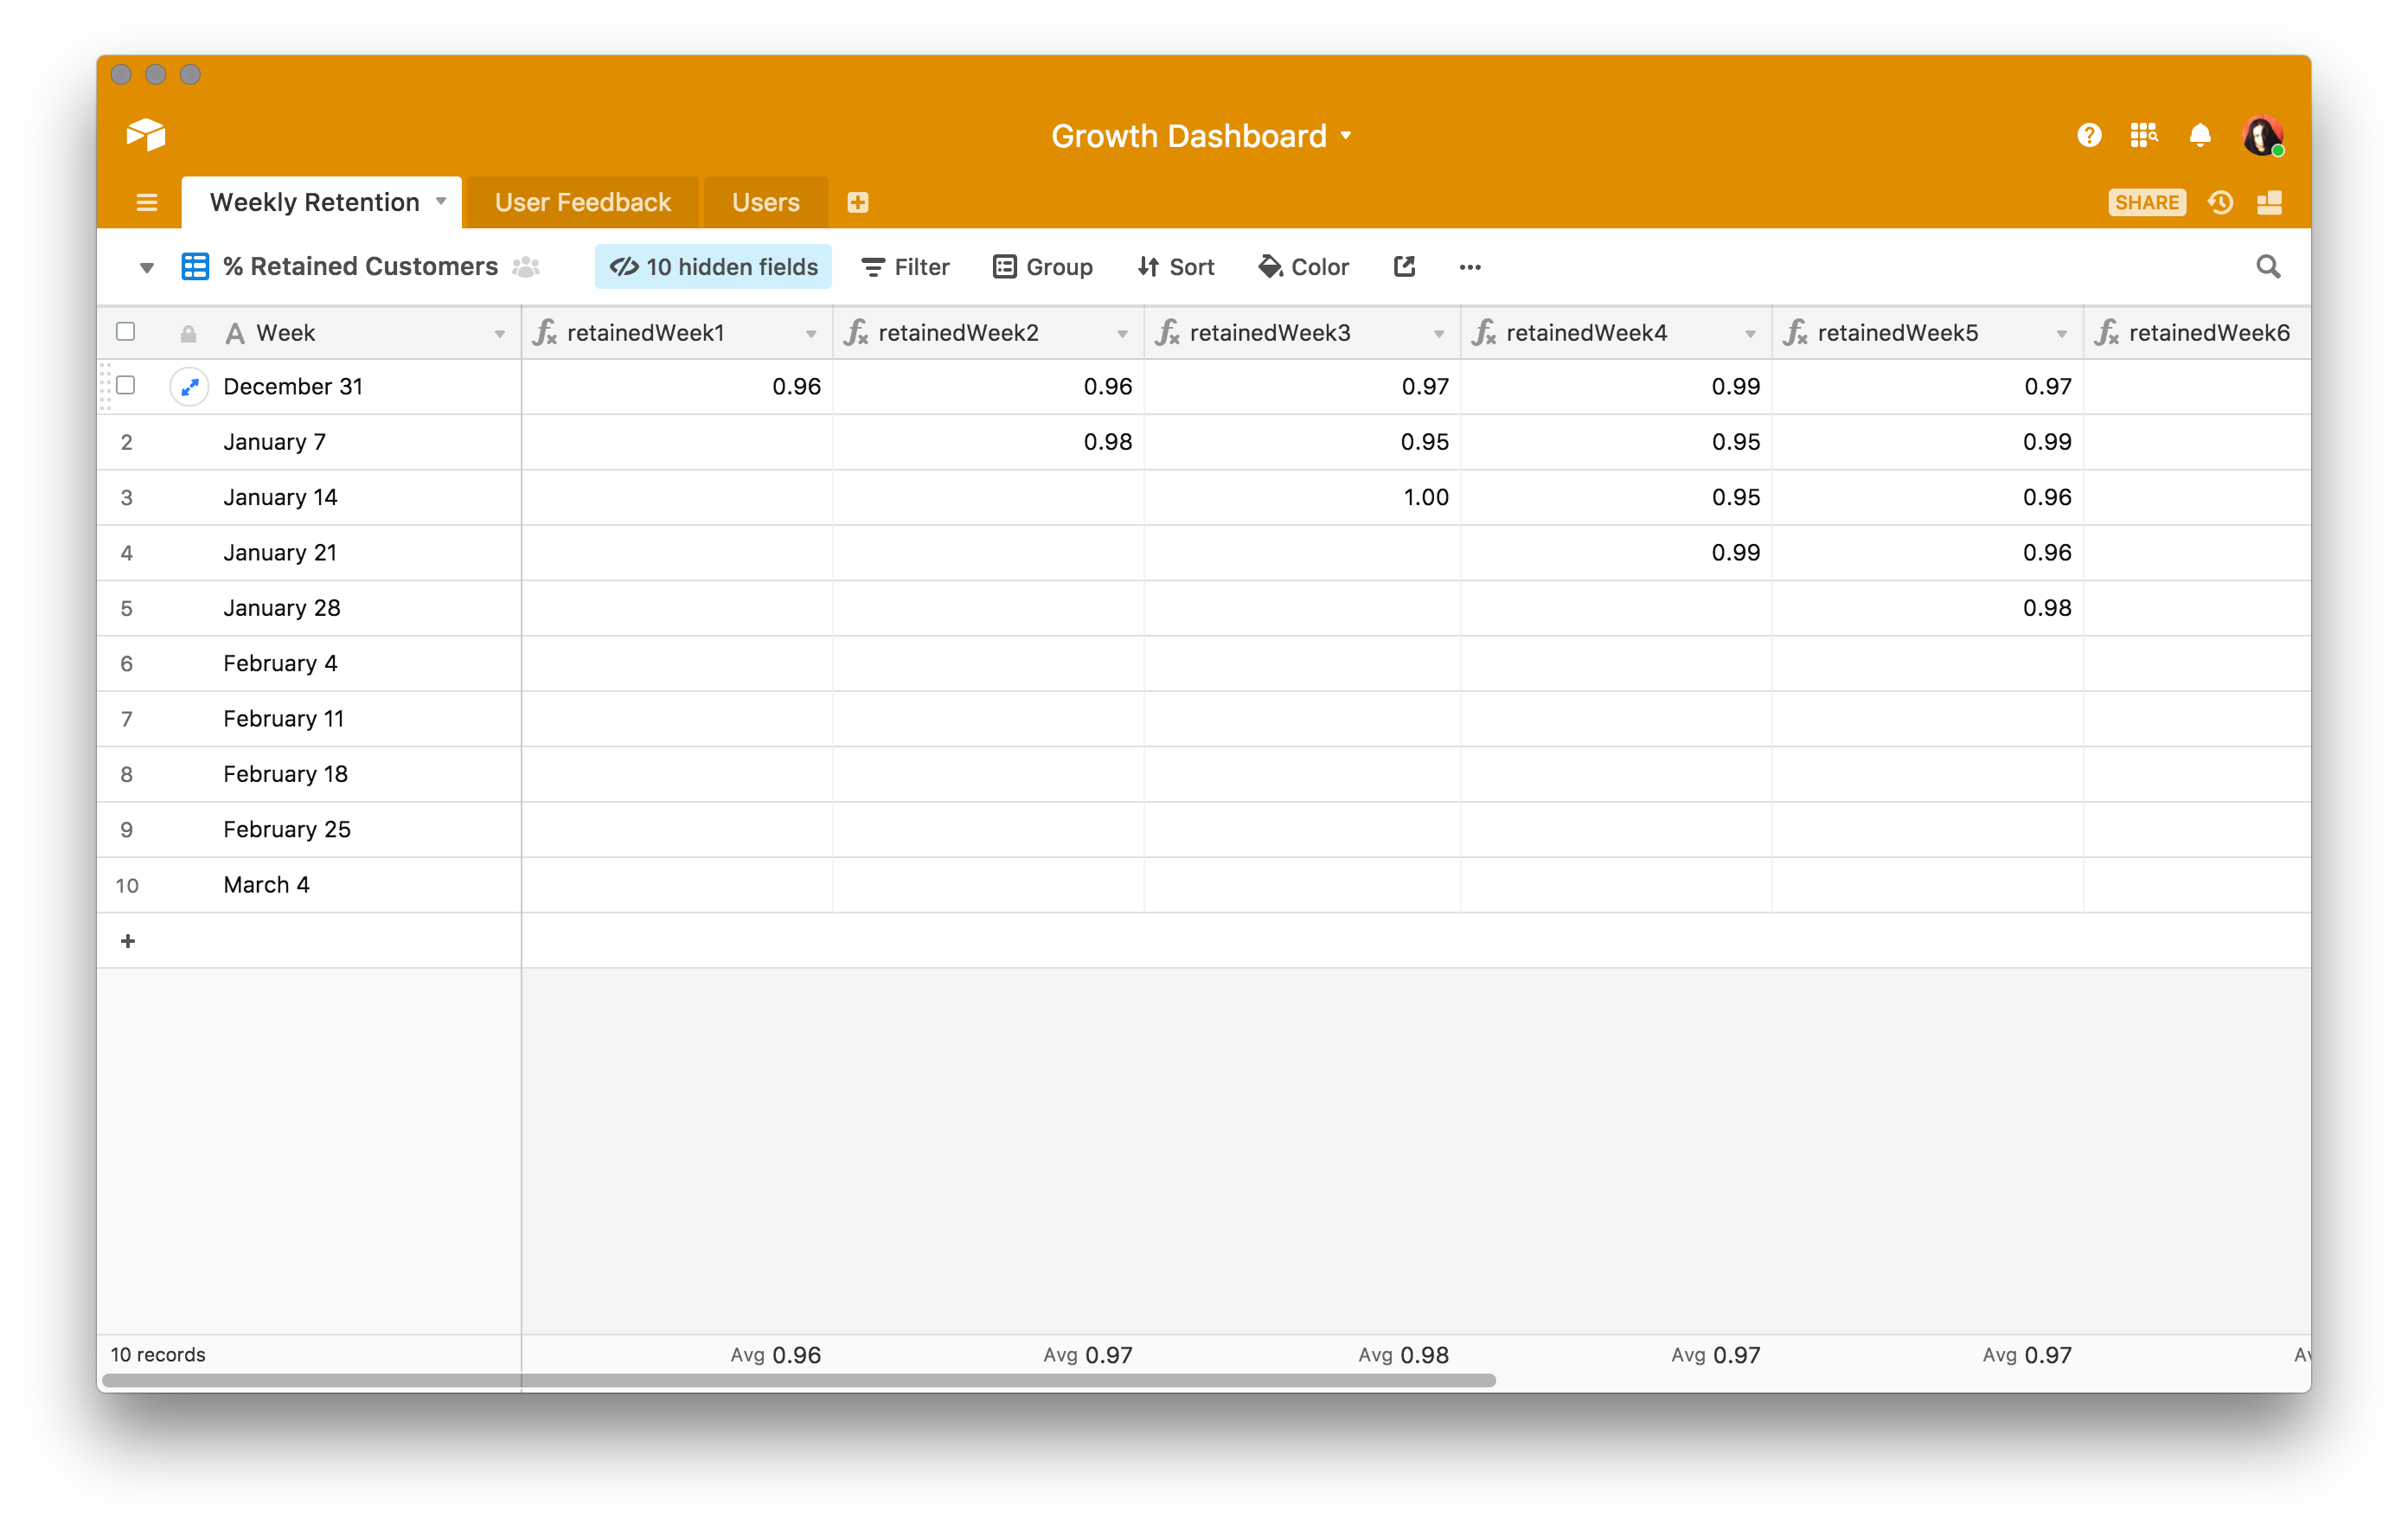
At a glance, this helps you quickly identify the size of cohorts, how well you're retaining each cohort, and the exact moments in time you're experiencing the sharpest drop in retention.
Identify users for feedback
Aggregate metrics help you define broader patterns within your user base. But you'll still want to dive deeper. In the case of retention, for example, it's important not just to figure out when people are leaving but why they're leaving—and oftentimes, the best way to find out is go straight to the source.
The challenge is that while most people know they should talk to their users, it's often time-consuming and difficult to find the right users to talk to. You have to be strategic about who you're reaching out to, and the type of feedback you're trying to get.
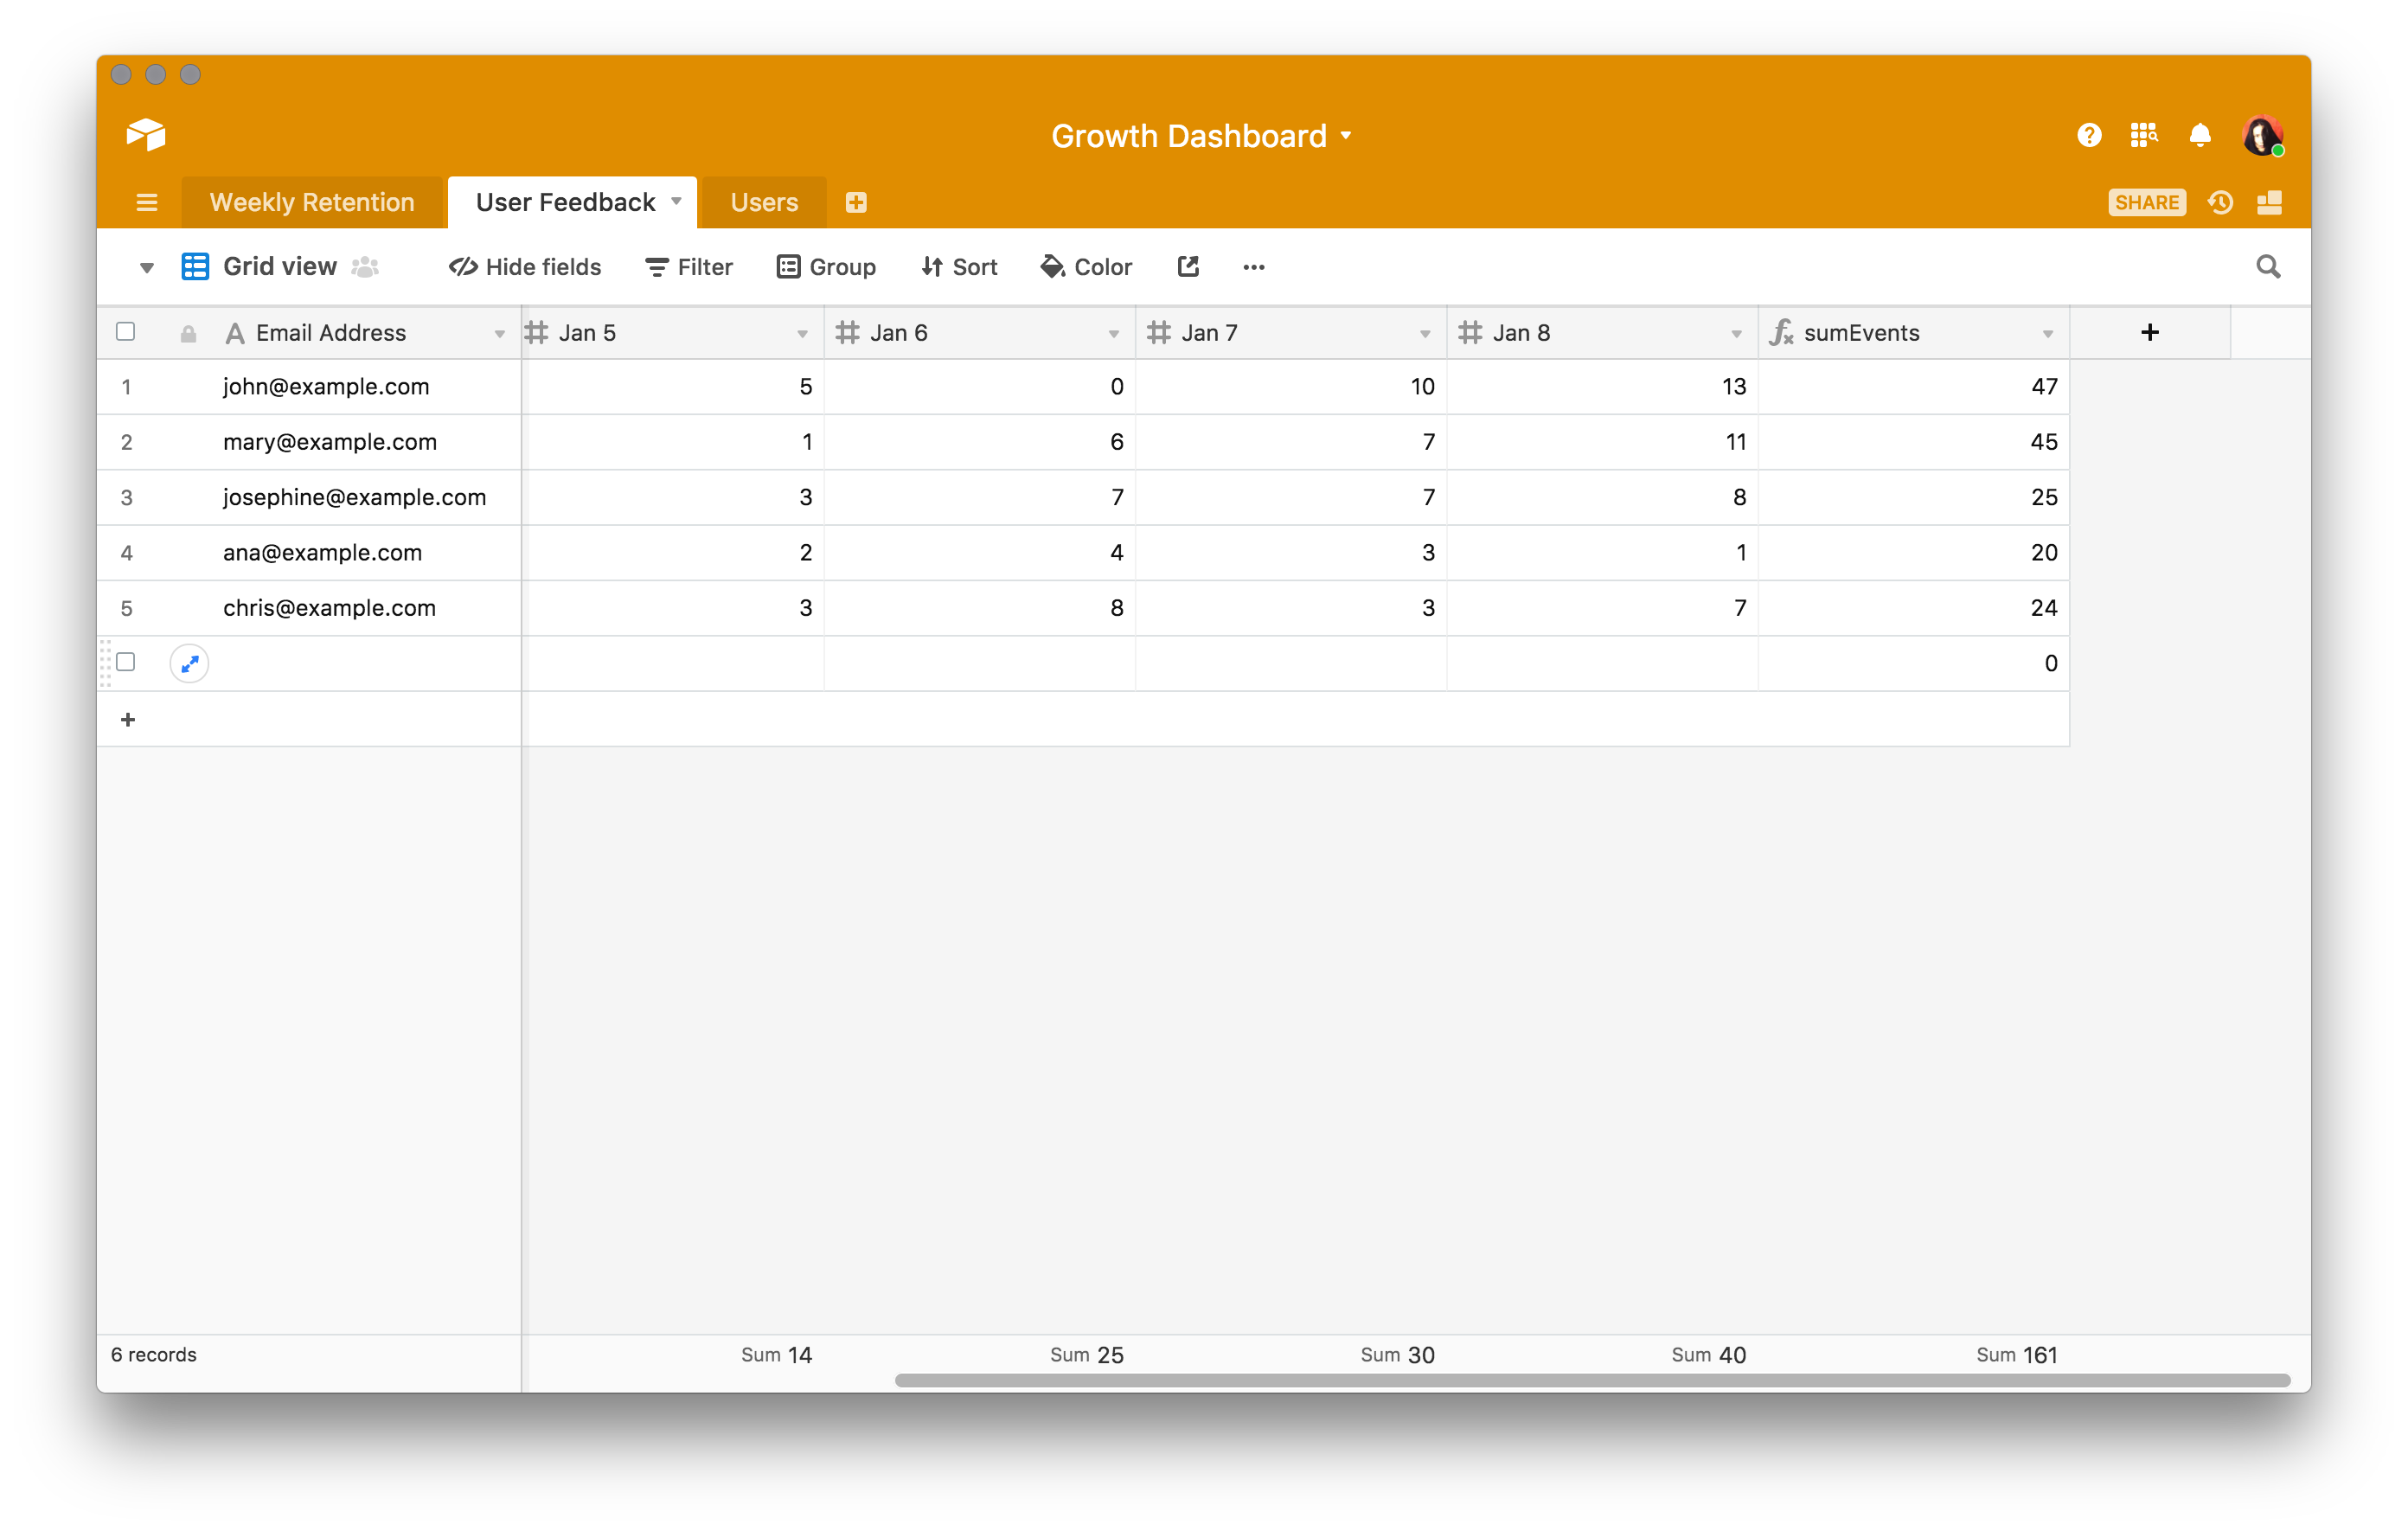
Say that you're trying to figure out how what caused a dip in retention from your cohort analysis above for the week of January 1st. You can create another table that shows each user's email, along with how many events they performed in your product each day of the week.
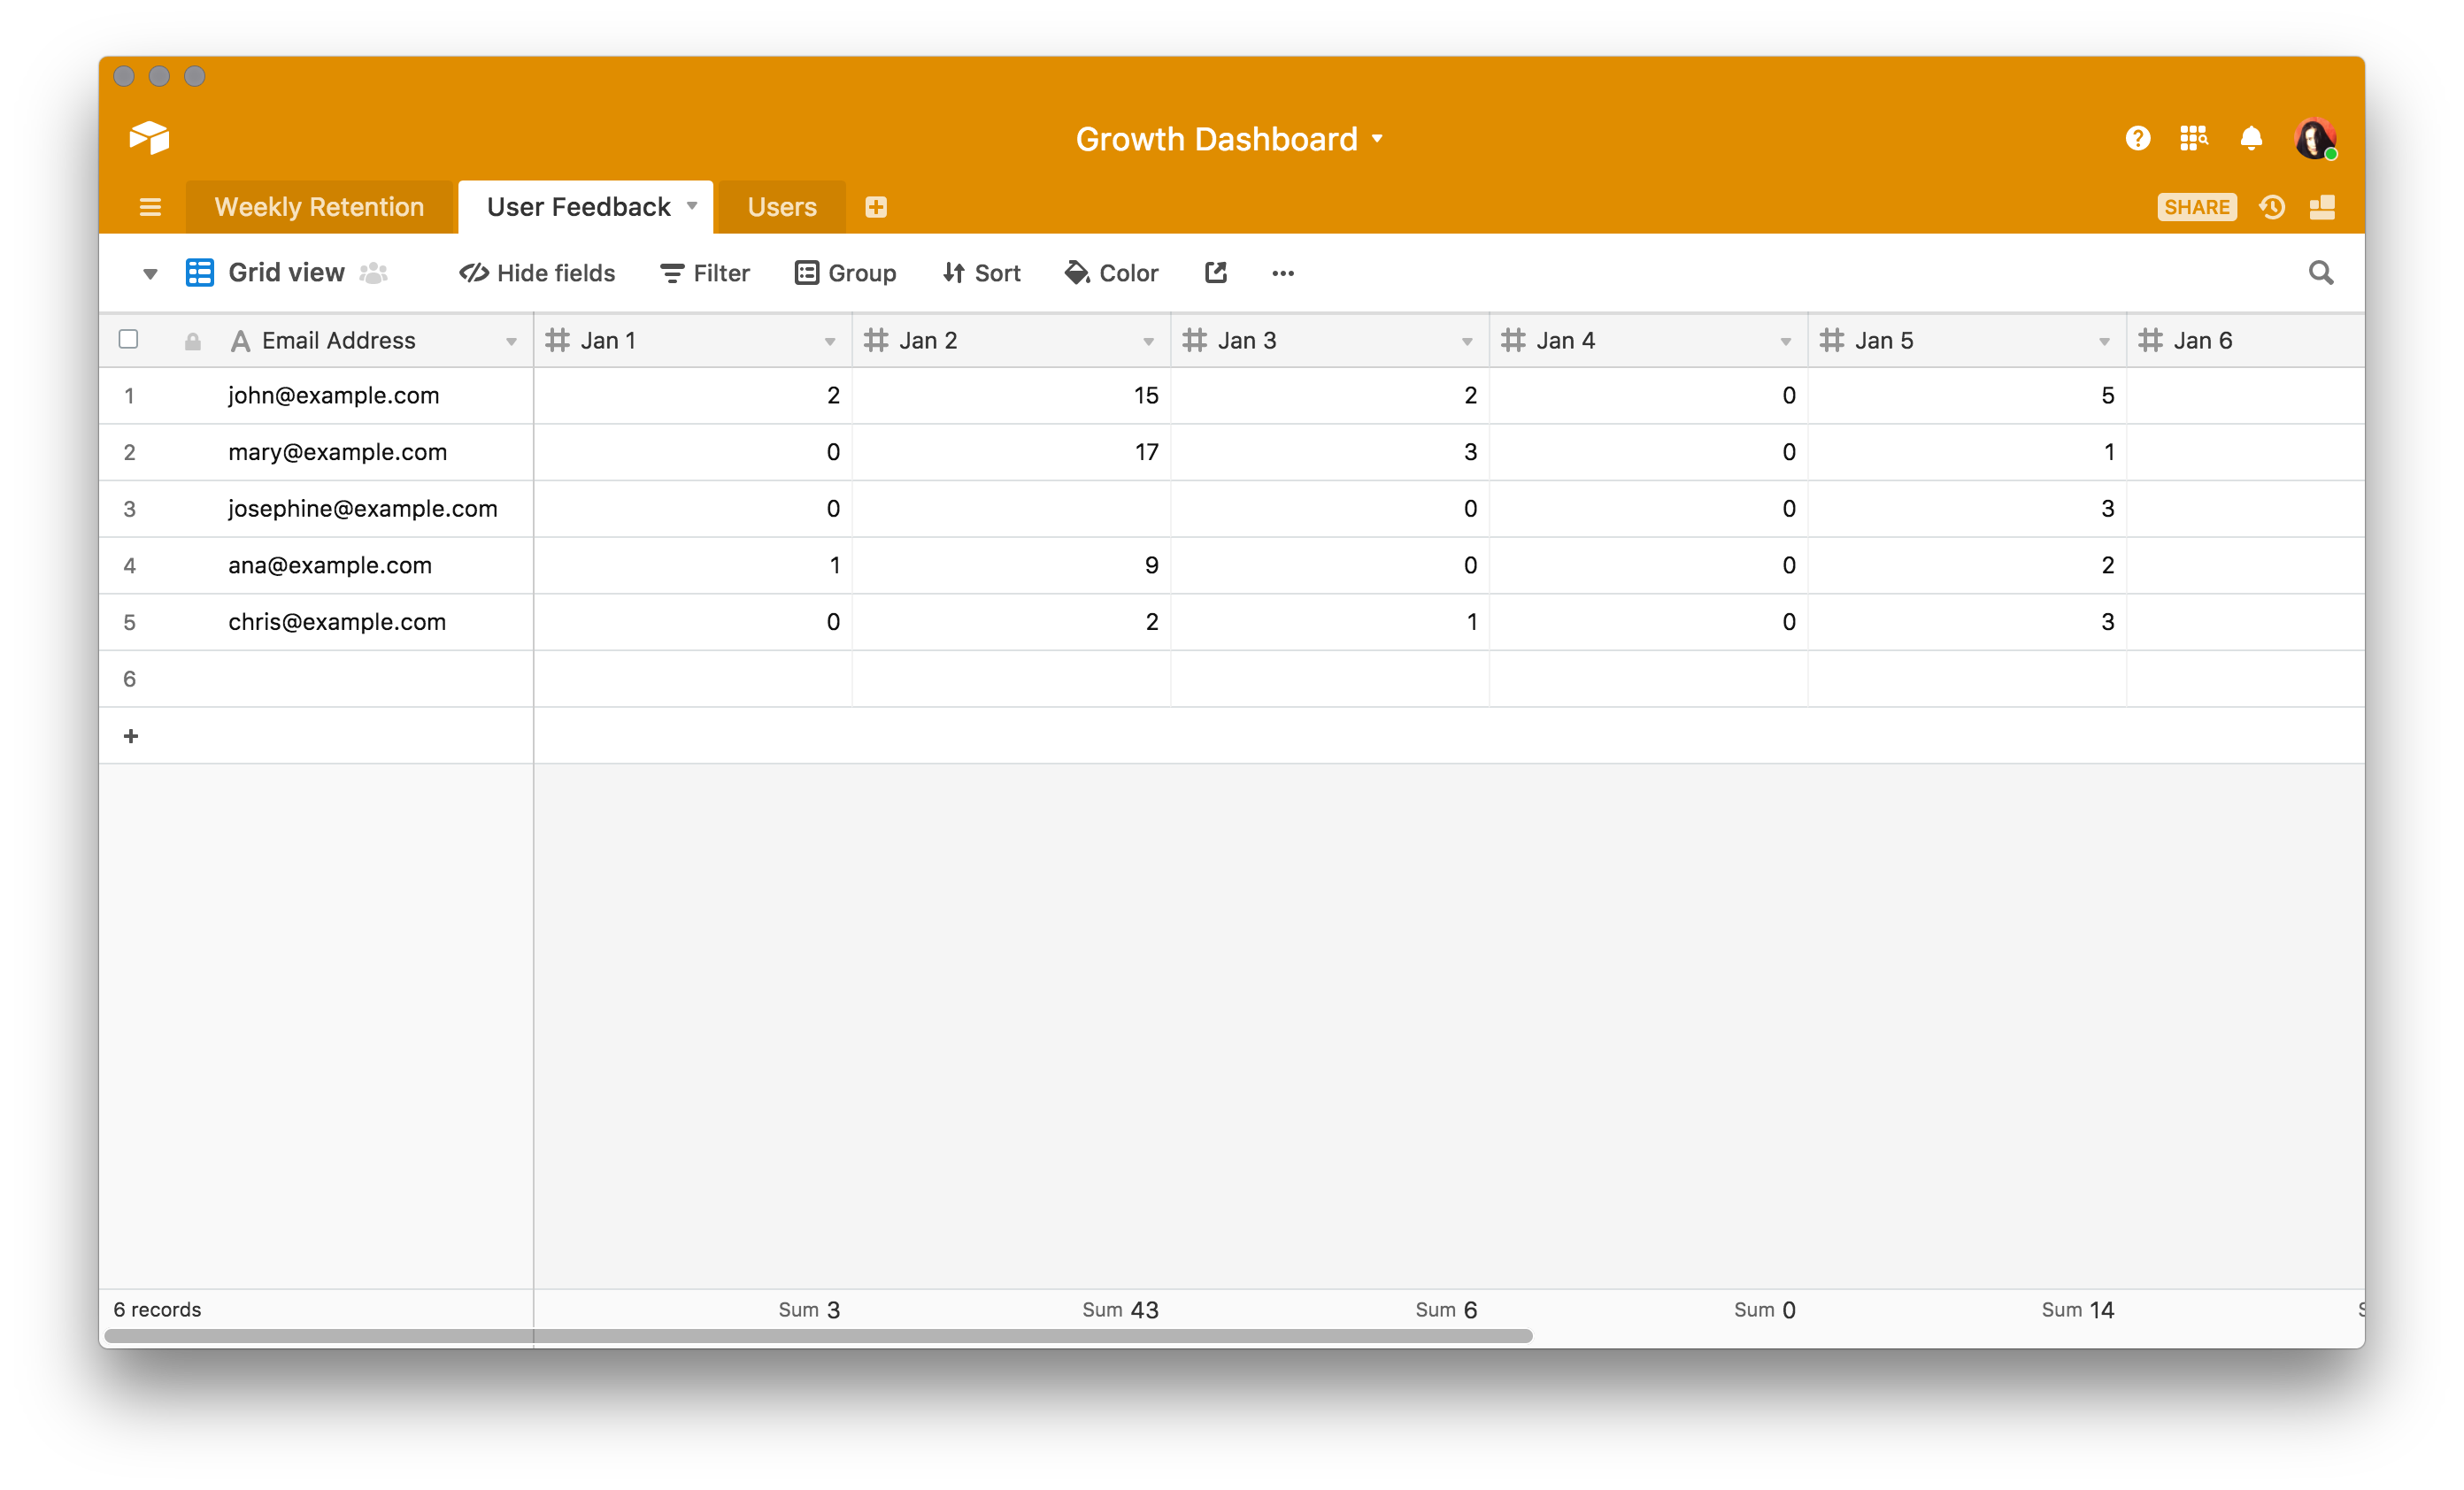
Once you have the data in an easy to read format, the next step is to segment those users into different groups so you can figure out who to talk to.
Dan Wolchonok, a product manager at HubSpot, advises segmenting users into buckets to identify the ones that might give the most valuable feedback. To figure out a dip in your retention, for example, you might create three different groups:
- Super active users: users who log into your product each day and use it constantly.
- Drive-by users: users who occasionally log into your product and typically leave immediately.
- Churning users: people who used your product regularly, but then dropped off after a period of time
With those buckets, we can create a separate view that automatically categorizes users into a bucket based on their engagement.
By creating a formula field that aggregates the number of events each user has performed over the week, you get a bird's eye view of activity that you can use to drill down further. Based on the table above, we can create a view that's automatically populated by users who have performed over 30 events within the week.
Automate feedback collection and analysis
Using Zapier, you can set up an automation where each time a user enters the Churned users view, it automatically sends them a form requesting feedback:
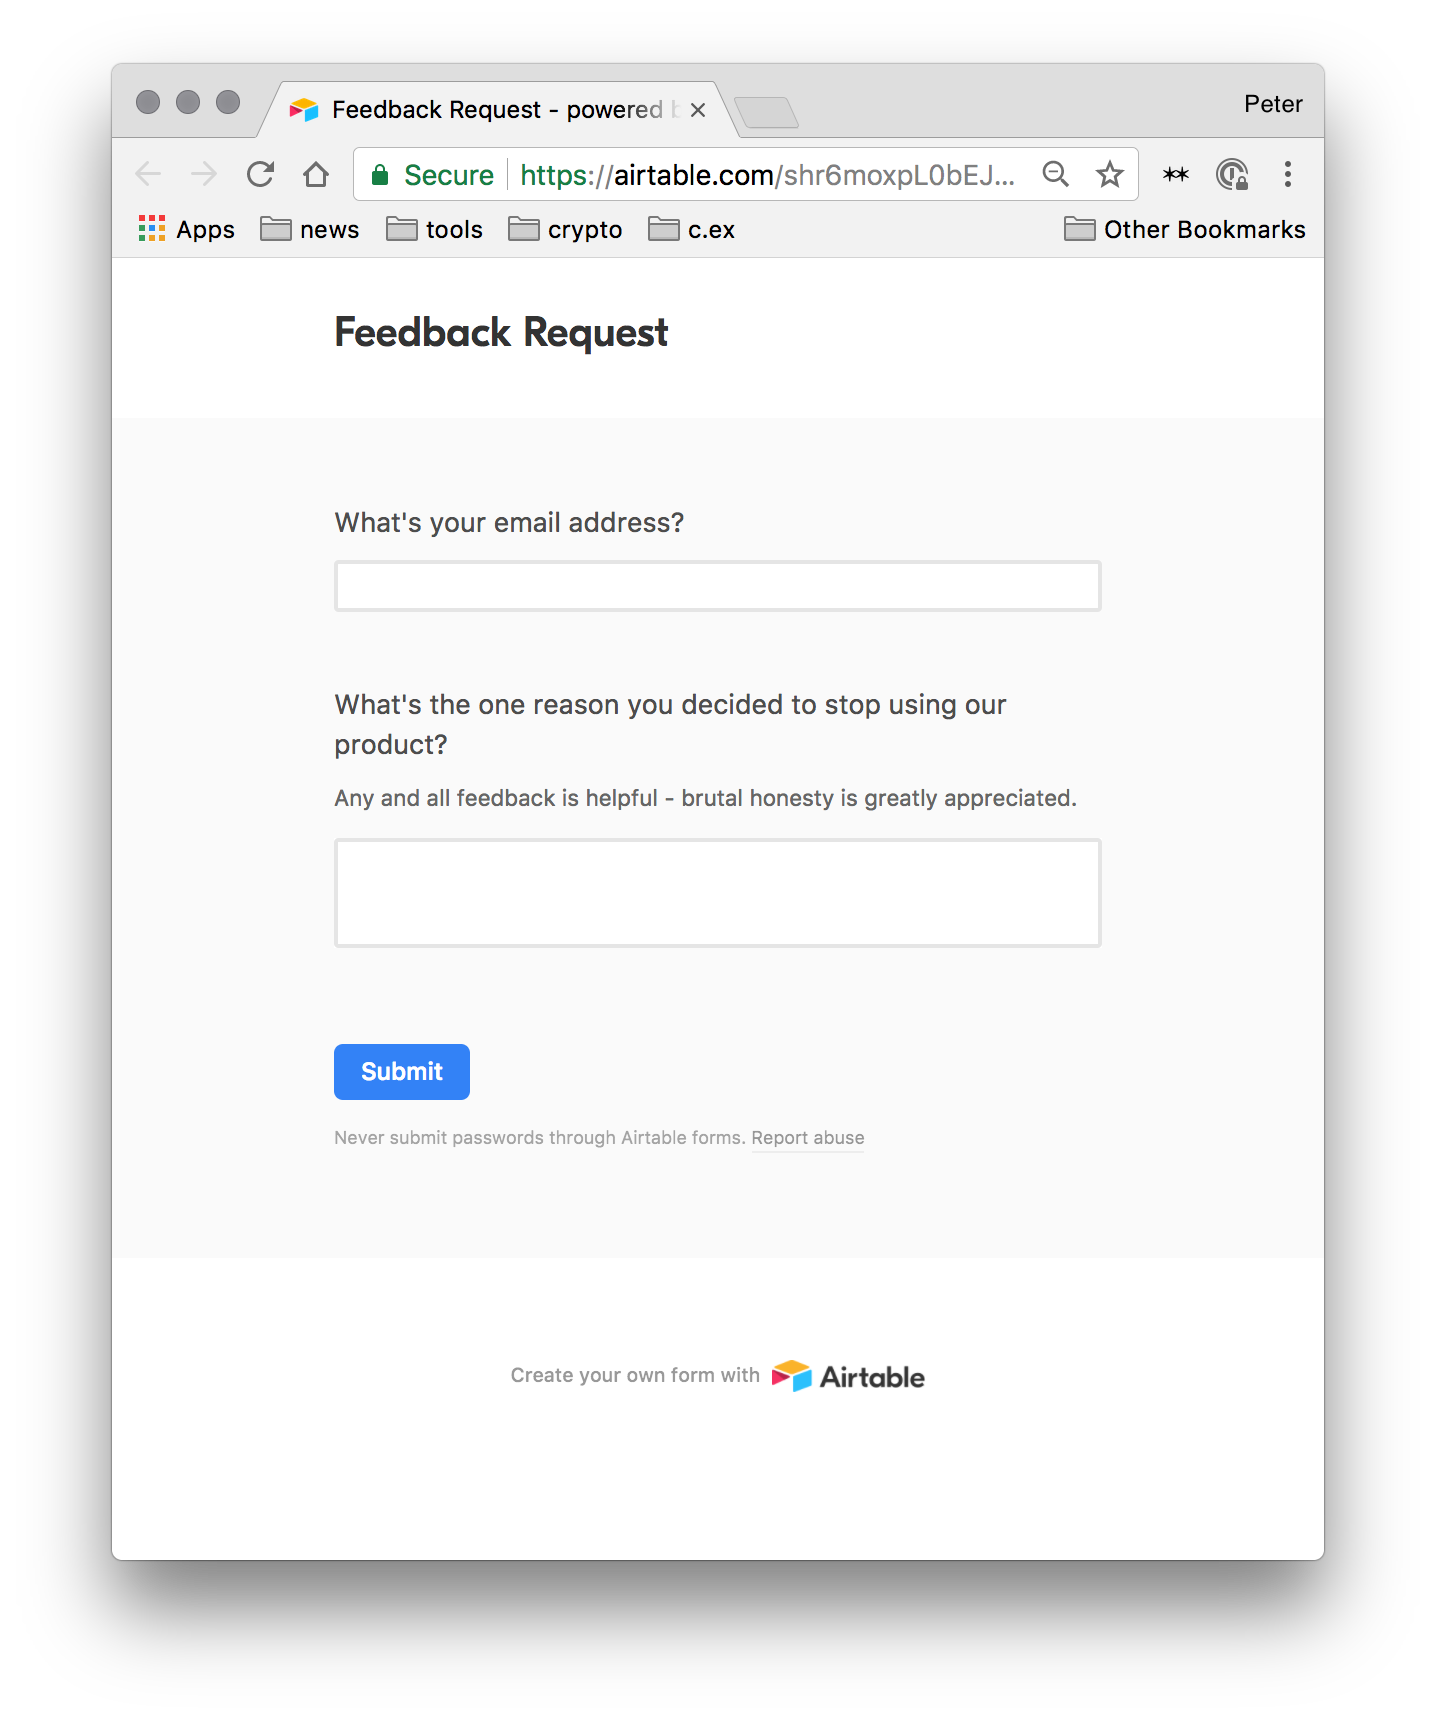
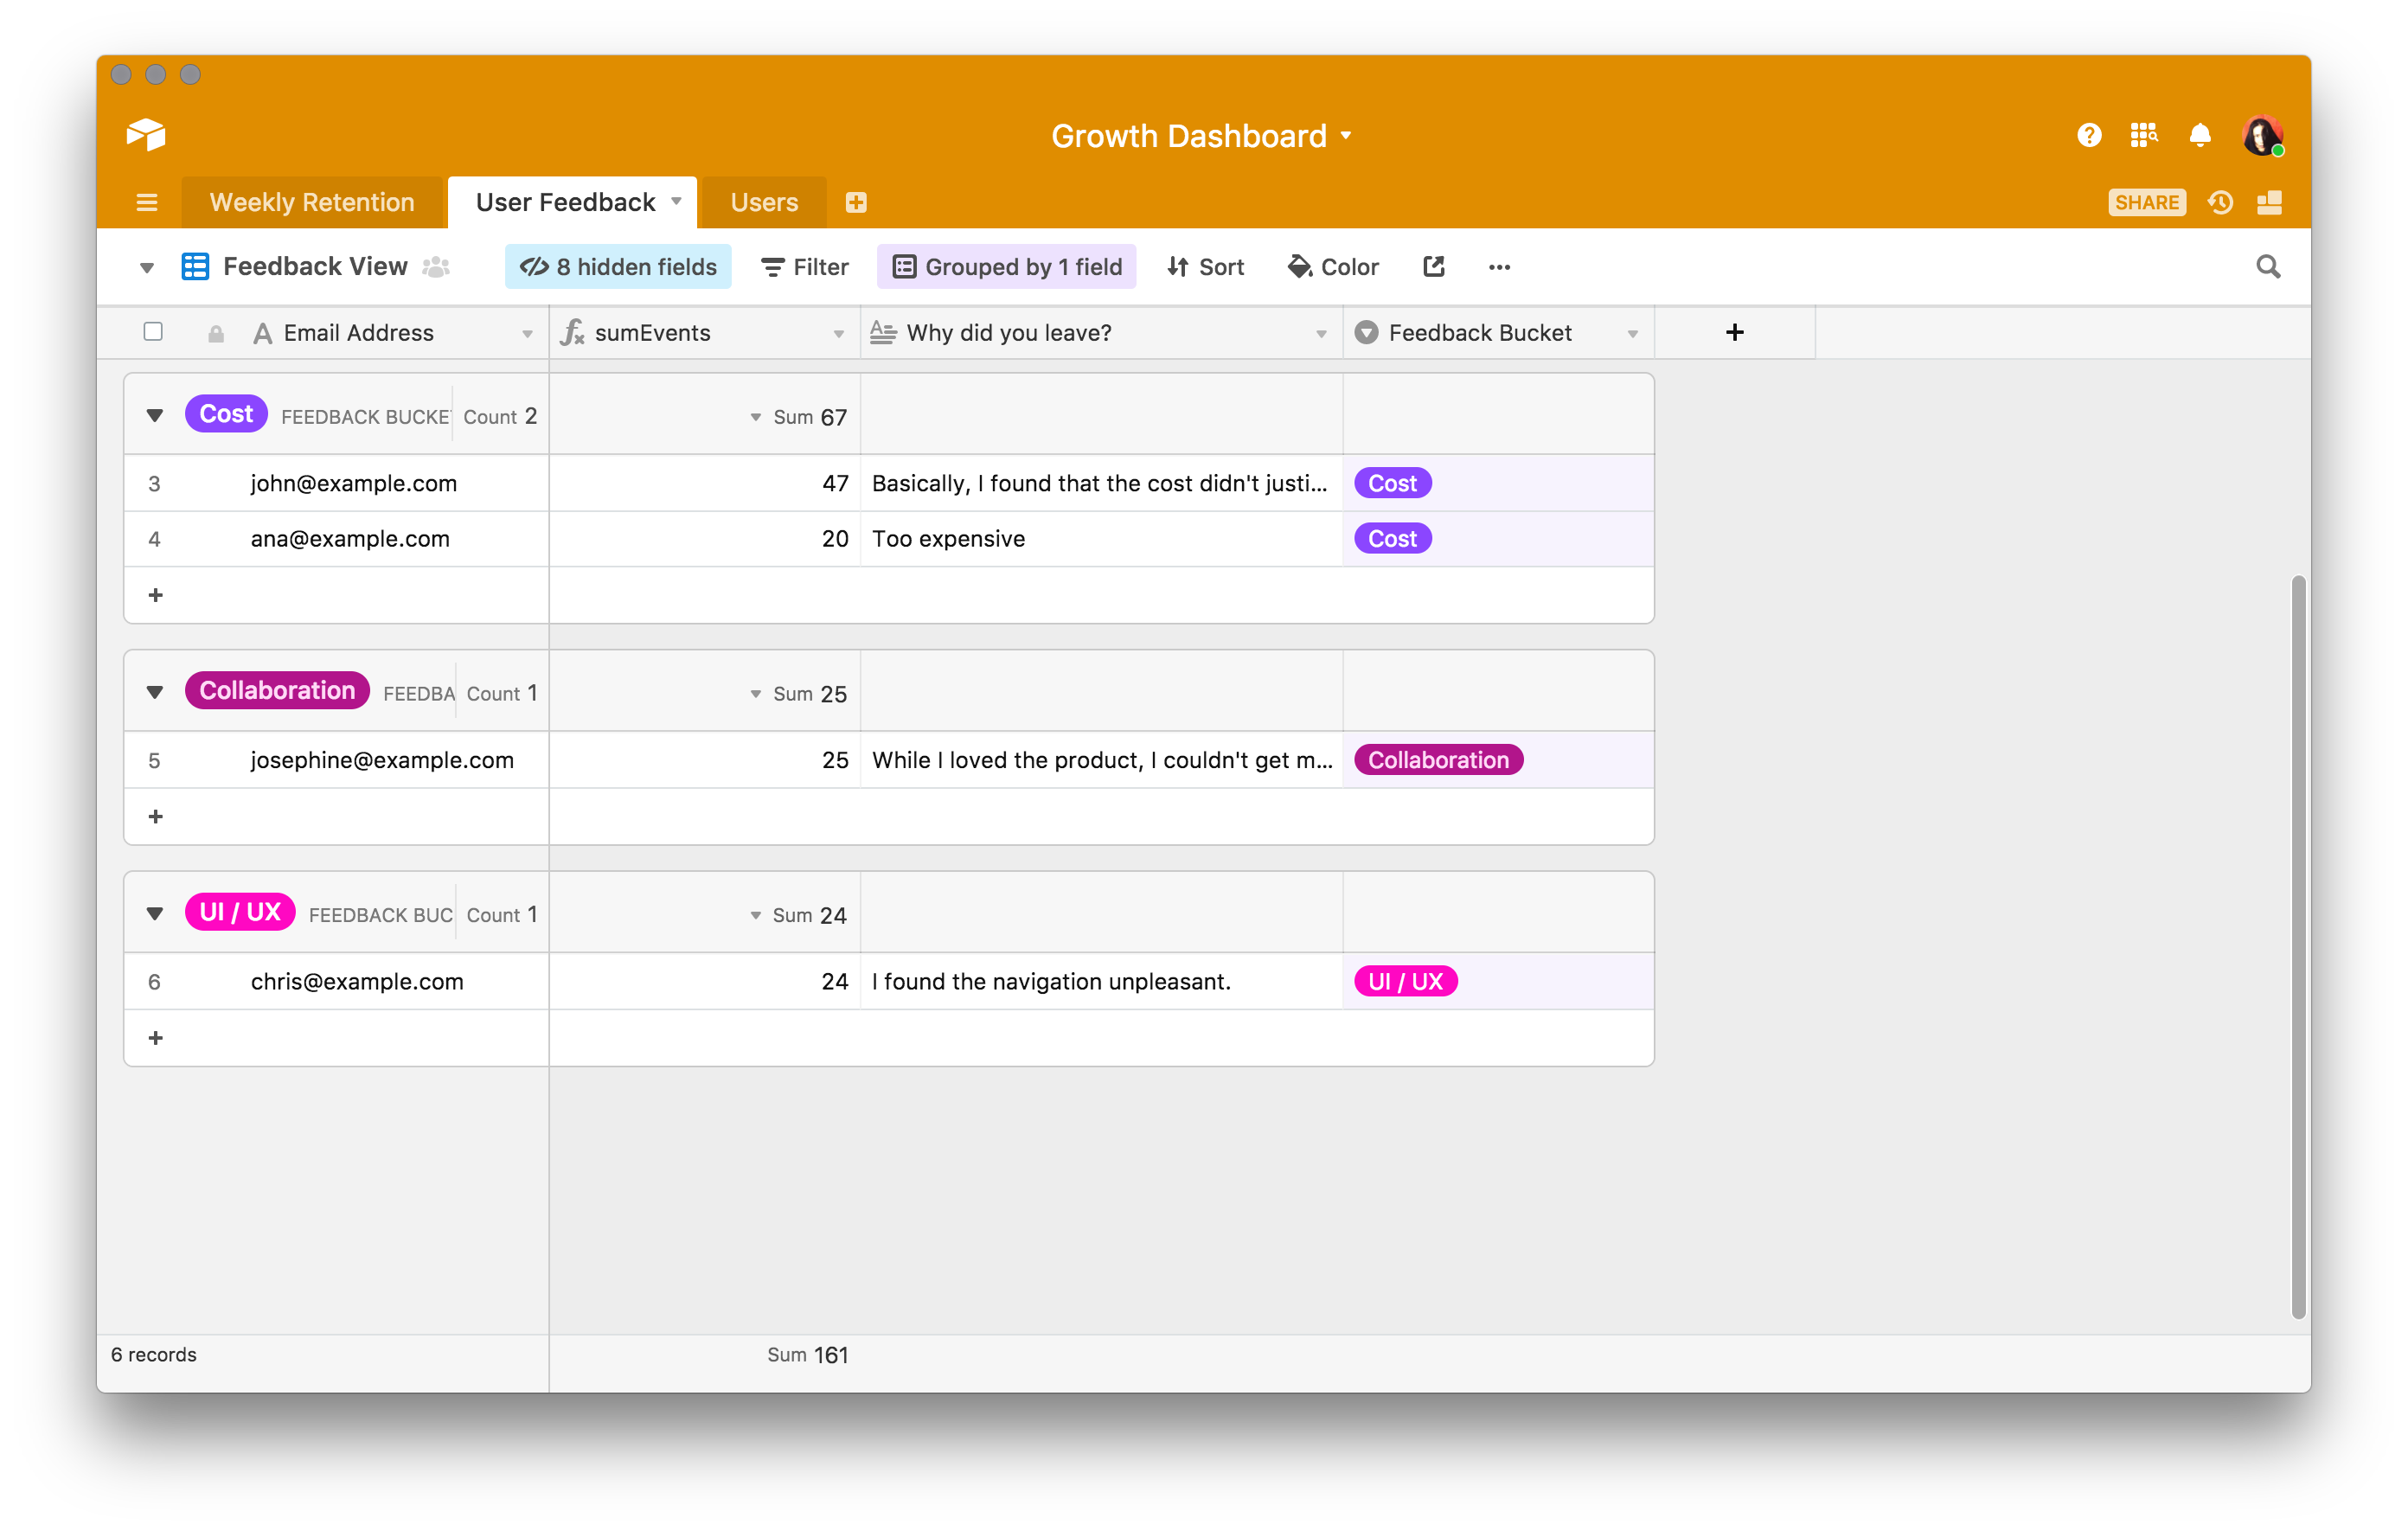
Responses are then logged into our table, where we can create another view to start organizing the responses into separate feedback buckets according to the primary reason a user left:
The hardest part of gathering user feedback often has to do with the process of how you identify users to talk to within the data, reach out to them, and finally collect those responses into a format that's useable. At each of these stages, the key is to find ways to eliminate the time you spend on logistics and manually sorting through the data.
Get more leverage on your time
Growth teams cross-functionally tackle elements of marketing, product and customer success. Moving the needle on growth is an exercise in constant experimentation. The ability to flexibly—and rapidly—implement new experiments, analyze the results, and share those results with your team is the key to growing faster.