“Can you pull a report on that?”
It’s a phrase that folks working with data get all the time—but not one that most love to hear. Especially when you’re working with multiple tools, sources, and types of data, compiling manual reports on-demand can be an inconvenience at best, and a major time sink at worst.
We built Airtable with lots of reporting and visualizing capabilities out of the box, like views and dashboards. But you might have additional data sources that you want to connect to and visualize. By connecting Airtable to the data visualization tools you already use, you can surface even more insights across data sources.
With these integrations, you can build advanced reports and complex dashboards using Airtable data in a few steps. That’s great news if you need to see interactions across multiple data sources. And it's also great news if you have more complex reporting needs—like seeing data from a campaign in Salesforce in the same place as campaign metadata you manage in Airtable, or seeing product usage data alongside related product launch initiatives.
Read on to learn how to integrate Airtable with Tableau, Google Data Studio, and Power BI and to get step-by-step guidance on how to get started with examples of how to leverage these integrations.
Or jump ahead to the integration you care about most:
- Tableau
- Google Data Studio
- Power BI
- Tableau Desktop or Tableau Server, version 2019.4+ (This includes support for the free version of Tableau)
- The Airtable WDC URL
- A target Airtable base in an Enterprise workspace
- Your Airtable API key
- A Google Data Studio account
- A target base in an Enterprise workspace
- Your Airtable API key
- A computer running Windows
- Power BI desktop or Microsoft Excel 2016 or later
- This query that connects Airtable to Power BI (via Power Query)
- Your Airtable API key
- The Airtable base ID and table ID for the data you want to pull in
- API_KEY: Here, you’ll want to use your Airtable API key. It’ll start with the letters “key.”
- BASE_ID: For this parameter, you’ll want to use the ID of the base you want to query (which you can find using the API documentation for your base). Your base ID will start with the letters “app.”
- TABLE_ID: You’ll want to use the ID of the table you want to query here. Find your table ID by navigating to a view of your table, and looking in your URL/address bar. Your Table ID will start with the letters “tbl.”
Note: The software made available in this post are not supported by Formagrid Inc (Airtable) or part of the Airtable Service. It is made available on an "as is" basis and provided without express or implied warranties of any kind.
Integrating with Tableau
With a Tableau integration, you can make visualizations that use both your Airtable data and your other Tableau data sources.
You can visualize Airtable data in Tableau using a Web Data Connector (WDC). WDCs let any developer build and maintain new connections to Tableau. With WDCs, end users can visualize tables and rows from new external sources (including Airtable) the same way you’d view other data sources.
Connecting Tableau to Airtable: a step-by-step guide
To start your integration you’ll need:
Note: You can also host the Airtable WDC yourself if you’d rather leverage your own infrastructure; just use the source code in the Airtable WDC. If you take this route, you may want to self-host the external JavaScript dependencies, too.
Now that you have your Airtable WDC sorted, set it up in Tableau in four steps:
Step 1: Open Tableau and from the “Connect” pane, select “More Servers…” and then “Web Data Connector”
Step 2: Enter the URL of the Airtable WDC and press enter
Step 3: Paste your API key in the “API Key” field. Then, select the base you want to use.
Step 4: Click “Go” and Tableau will retrieve the list of tables from the base.
Now, you can use your Airtable data in Tableau like you would any other Tableau data. For more details on the Airtable Tableau integration (including more on table configurations and self hosting), check out this guide to visualizing Airtable records in Tableau.
Syncing your Tableau data can be beneficial for any number of roles, but we think it's especially useful for project management. As a project manager you can capture project data in Airtable like timeline, responsible teams, and completion dates, and visualize how teams are tracking toward their goals in Tableau.
Integrating with Google Data Studio
Google Data Studio (or, Data Studio) lets you create easy-to-share reports and dashboards. Data Studio Community Connectors bring any internet-accessible data source into Data Studio, including Airtable.
This integration is good for anyone who wants to create and share dashboards. For example, let’s say you’re running a grant program at a nonprofit organization, where you log all your grant information and award data in Airtable. By bringing your Airtable data into Data Studio, you can track their impact on org-wide goals to help plan for next year’s grants.
Connecting Data Studio to Airtable: a step-by-step guide
To get started, you’ll need:
From there, you'll need to self-host the connector script in your own Google Scripts account. To do this, follow these five steps:
Step 1: Create a Google Apps Script project
Step 2: Paste the code from the files Code.js and appsscript.json from the airtable-gds-cc repository to your project
Step 3: Test your community connector
Step 4: Create a deployment of your community connector
Step 5: Share read access of your community connector with anyone that will use the connector (we recommend link sharing so it doesn't show up in anyone's Google Drive)
Now you can retrieve Airtable data from any of your bases—just like you would for any other source in Data Studio.
Integrating with Power BI
With Power BI, you can create reports and dashboards that combine your Airtable data with your other data sources. This lets you deliver insights from across your tools for better decision making—like if you’re using Airtable to manage budget on a launch, and Salesforce to measure business impact.
The Power BI integration is especially powerful for folks like marketing managers that need to build reports to show campaign progress and performance metrics in real-time.
To connect Airtable to Power BI, you’ll need to use Power Query, Microsoft’s data connection tool. With Power Query, you can pull records from Airtable into Power BI (and Excel, too, if needed).
Connecting Power BI to Airtable: a step-by-step guide
To get started, you’ll need:
Then, connect your Airtable table to Power BI in three steps:
Step 1: Create a query
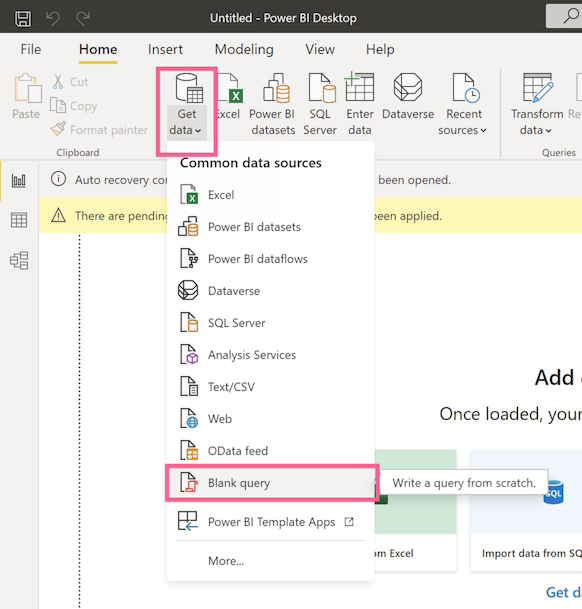
From Power BI, create a blank query by navigating to “Get data” > “Blank query.”
Step 2: Create your parameters
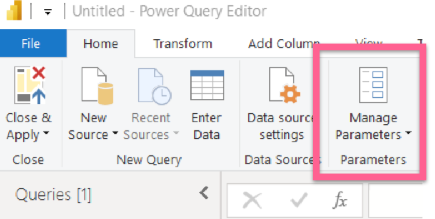
Now, you'll need to create and define your parameters (from the template M Query). Power BI's Query Parameters let you define the variables for your query. For each parameter you’ll want to set a Name, Type, and Current Value. All of the parameter types should be set as text; we'll set the Name and Current Value using the keys and IDs listed below:
Step 3: Paste in your query
Finally, paste your query into Power BI, and you’re ready to go.
With Airtable connected as a data source, you can then prepare, model, and visualize your data just like you would with any other source in Power BI. For more info on the Power BI data configuration options, see our deep-dive walkthrough.
Try it out for your marketing department. As your team captures campaign costs, timelines, and results in Airtable, you can leverage Power BI to visualize profitability, break-even points, and campaign scope.
Other ways to use Airtable data in your data visualizations
If you’ve already integrated Airtable with a data warehouse—or if you're looking for a native integration to your data visualization tool—you have a few other options.
If you’re using a separate database like MySQL, Postgres, or a data warehouse like Snowflake, you can also pull your Airtable data into those platforms. From there, you can set up a periodic sync via native integrations from Tableau, Power BI, or Google Data Studio. If you’re using Snowflake, you can also use this method to push your data to Looker or Qlik.
If you can’t make a direct connection between Airtable and your data visualization tool, you can export CSVs of your data from Airtable and import them into Tableau, Power BI, or Data Studio. Just keep in mind that you’ll have to repeat this process every time you need fresh data—so it’s best to reserve this method for one-off analyses.
Get started building advanced reports
We can’t wait to hear what types of advanced reporting you build using your new integration. Be sure to check out the Airtable Universe for more ideas on how to use Airtable at your org.