From the outset, project management can seem like a simple framework for getting tasks done—that is, until it becomes incredibly complex. Competing deadlines, detailed deliverables, and budget approvals can quickly add up to a muddled workflow.
Conquering your core processes is the key to executing multiple projects at once, and ensuring that your team can handle scaling up its workload. With the right system, balancing team leads and remote contributors, reporting on project status and spend, and checking off action items on schedule can feel effortless.
Adding Airtable Apps to your project management process can help you speed through capacity planning, make sure the dates and projects that matter most are always top of mind, and give stakeholders a window into your team's performance—without growing your to-do list. And anything that saves you a few minutes is another step toward hitting your project goals.
Here's your plan for putting this into action:
Focus on what's up next
Balance workloads and time spend
Automate updates for stakeholders
Keep tabs on virtual contributors and projects
Focus on what's up next
Managing multiple projects, launch dates, and contributors can create a lot of noise. Zero in on your most important deadlines and projects with apps that keep them front and center.
Never miss a deadline
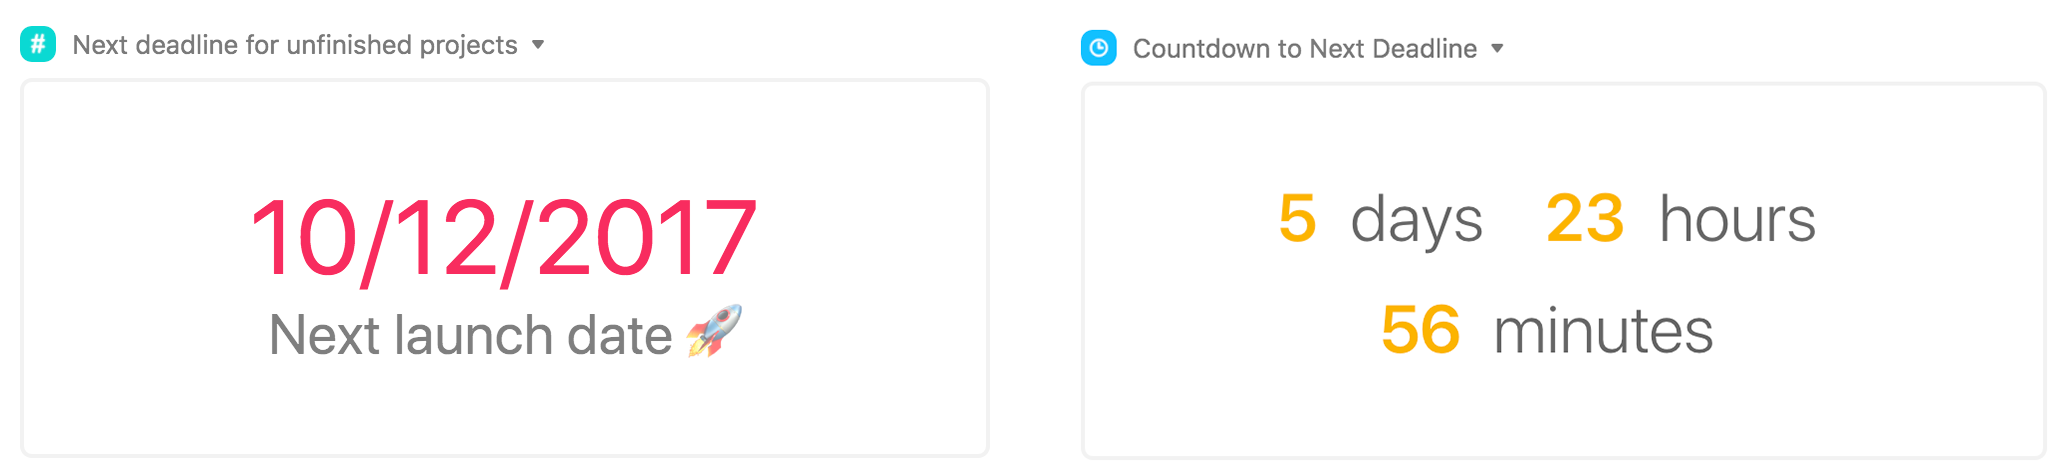
Sync the summary app with your next big launch date, and use the countdown app to tick off the time until your next task is due.
Step 1: Make a list of projects, and a view of current ones.
If you don't already have one, make sure that your base has a table of projects, with details like due dates, owner, and status. Create a view in the table that's filtered down to incomplete projects—you'll want to use this to power both apps.
Step 2: Add a summary app and a countdown app.
Open the apps menu and select the add a app option. From here, add both a summary app and countdown app to your base.
Step 3: Choose the dates you want to track.
For the summary app, select the incomplete view and choose the Summary option, then the field that holds due dates. Set the summary type to Earliest date.
In the countdown app, toggle the Date from view option and select the same view of incomplete projects. Make sure Earliest date is selected and check off the units you'd like to track.
Quickly reference current projects
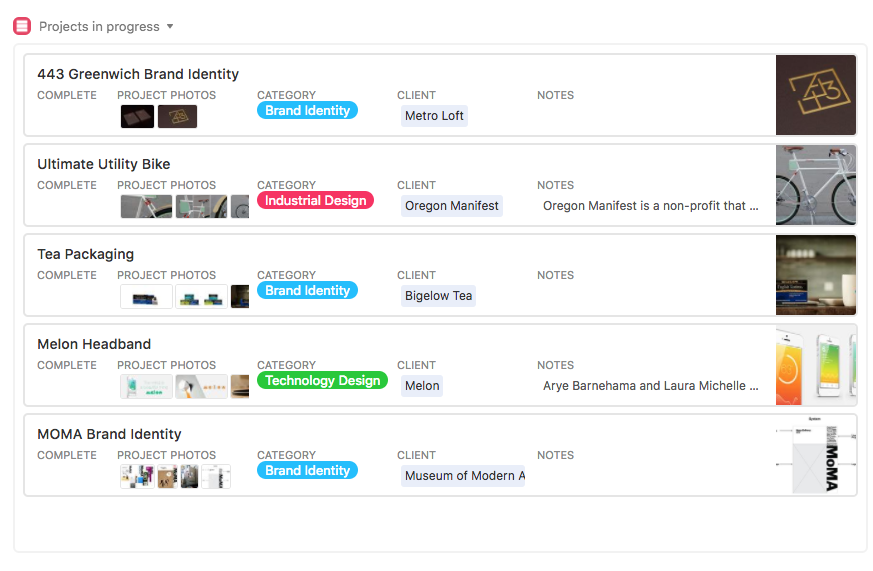
Use the record list app to create an always-up-to-date list of open projects.
Step 1: Create a view showing your current projects.
If you don't already have one, create a view in the table that's filtered to show just the projects that are currently sitting in your pipeline.
Step 2: Add a record list app.
Next, choose the add a app option from the app menu, and add a record list app to your base.
Step 3: Configure the record list app.
From the dropdown menu in the record list app's settings, select the appropriate table and the view you created in Step 1. This detailed look at your list of records will stay current as projects move in and out of the view.
Balance workloads and time spend
Executing projects on time is all about fine-tuning your team's priorities. Fuel your strategy with quick insight into each contributor's overall workload, as well as the nitty-gritty of how they're spending their time.
Check team bandwidth and project status at a glance
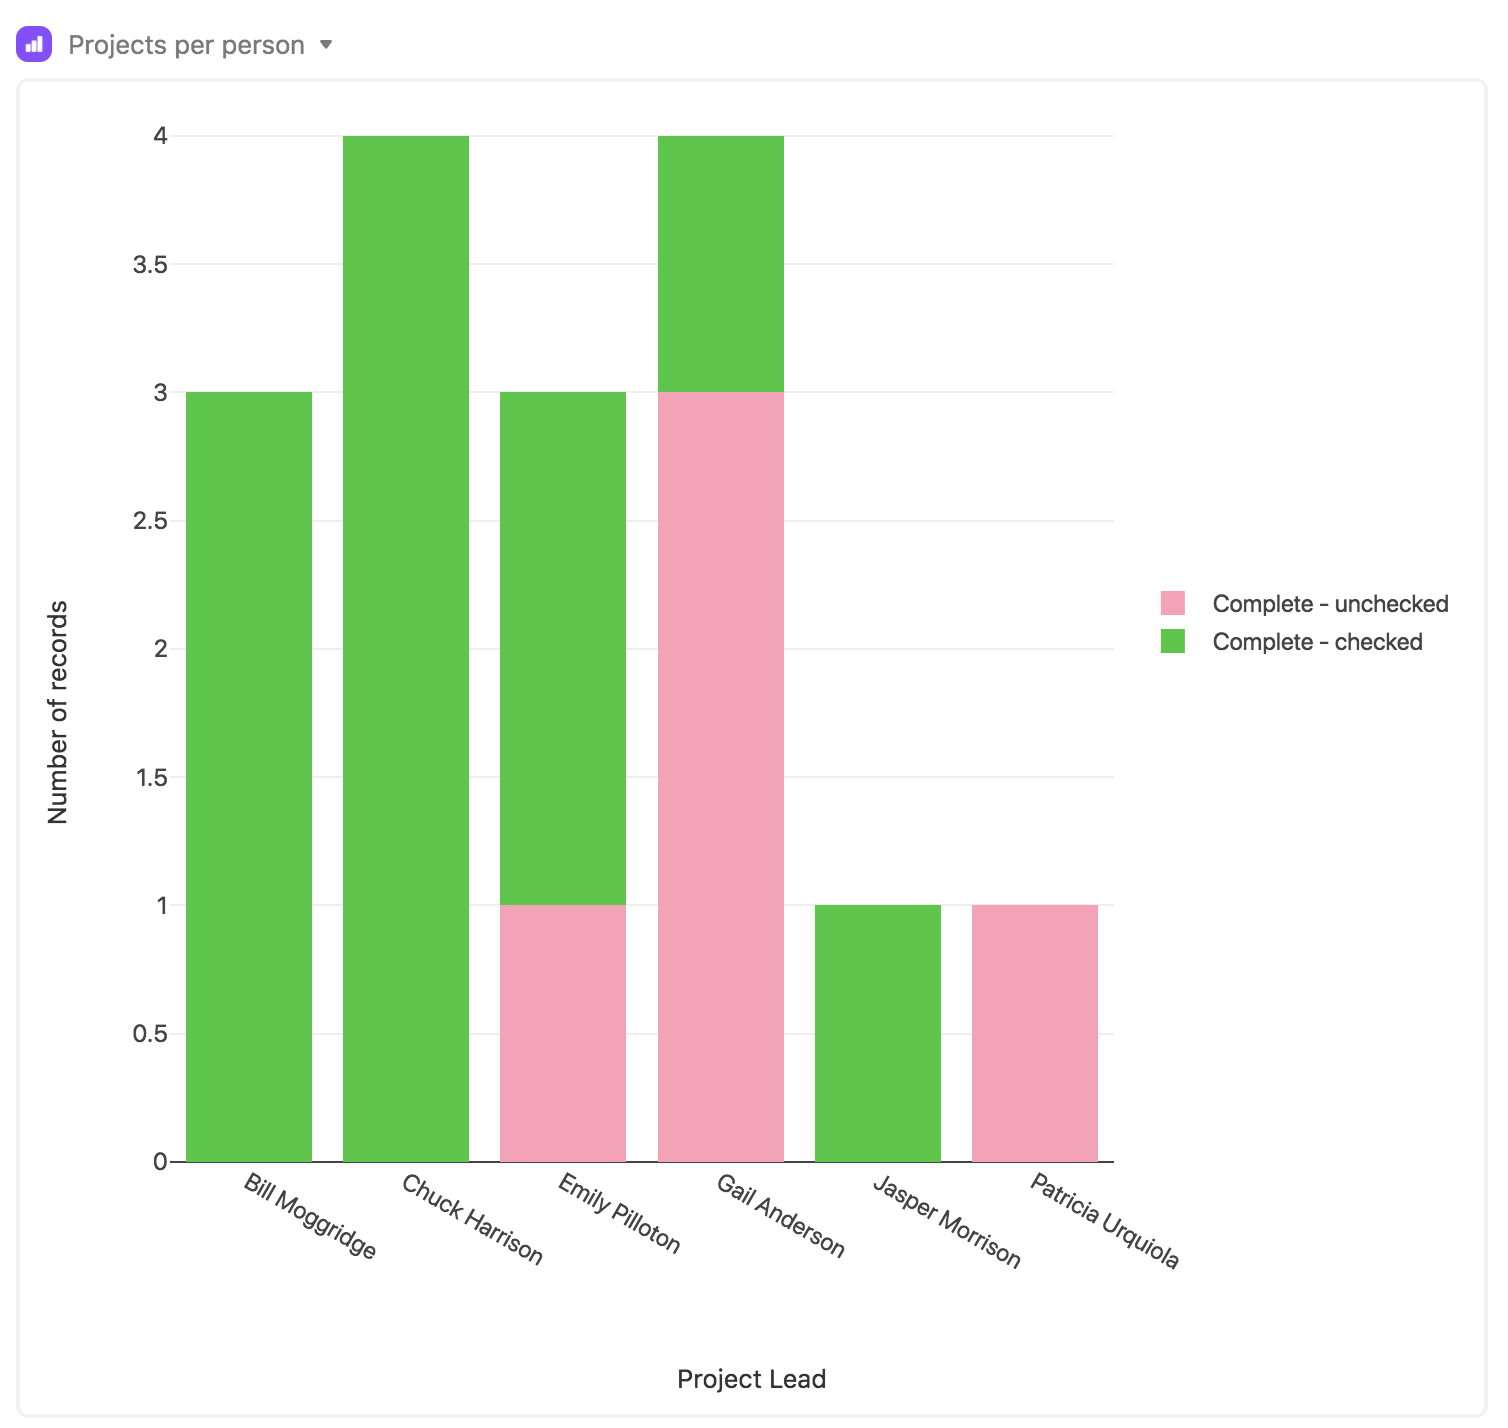
Use the chart app to show the number of projects allocated to each team member, and see their current status.
Step 1: Add a chart app to your base.
Open up the apps menu, click the add a app option, and add a new chart app to your base. With the chart app, you can make a bar chart, a line graph, or a scatter plot.
Step 2: Adjust the chart app to fit your needs.
Once you've added the chart app, you can tweak the settings to match your needs. Of these three types of graphs, a bar chart is best suited to comparing between different groups, so we suggest a bar chart for quickly seeing the number of projects assigned to each contributor. But of course, you can pick whichever type you want.
If you're doing a bar chart, we recommend that the X-axis be a collaborator or single select field showing who's in charge of the project. You can take it a step further, as above, by having the bar coloring indicate completion status. In the Y-axis section, select “Group by,” then a checkmark or single select field that corresponds to project status. In the example above, the “Stack” option is also toggled on to achieve this formatting.
Capture time-tracking data without leaving your base
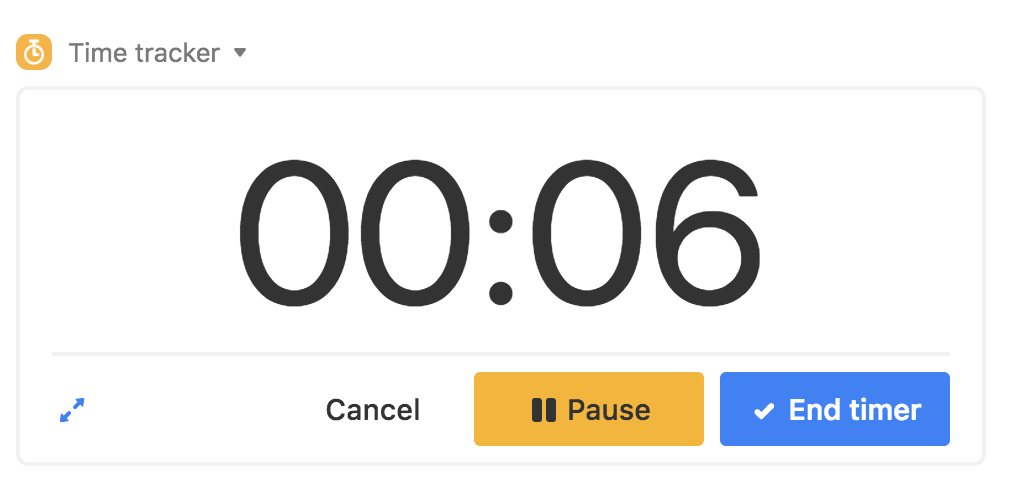
Connect the time tracker app to relevant projects, and let team members easily report time spent as they work.
Step 1: Create a field for logging time tracked.
In a project or task table, make sure you have three field types in place: a collaborator field for project contributors, and a date field and duration field for capturing the session that contributor is tracking.
Step 2: Add a time tracker app.
In the apps menu, select the add a app option, and add a time tracker app to your base. Point the settings toward the fields you just created.
Now when teammates are ready to log a session, they can simply hit the Start timer button and get to work!
Automate updates for stakeholders
If you're juggling multiple timelines, chances are you need to report on progress—and budget—to a range of interested parties. Apps can generate slides and tables that are always in sync with your latest project status.
Instantly create up-to-date project decks
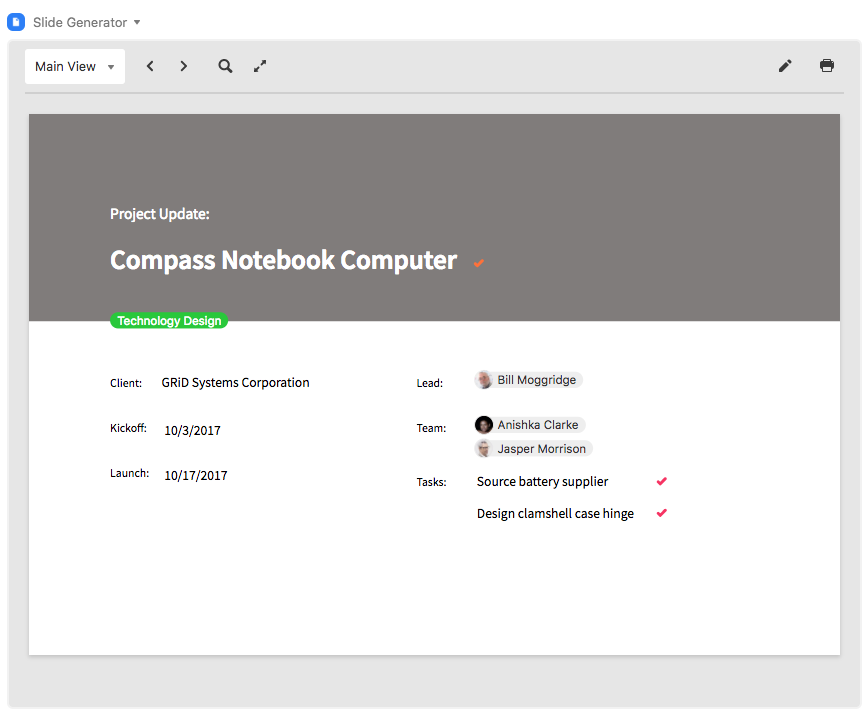
Set up the page designer app to quickly export the latest project statuses into polished slides ready to share with stakeholders.
Step 1: Add a page designer app.
Select the add a app option in the apps menu, and add a new page designer app to your base. Make sure to pick the correct table and view. You should select the custom page size and input the dimensions that you'll need for your assets.
Step 2: Design your slide template.
Choose the pieces of project data you want to present in your deck. You can drag and drop elements onto the page, tweak fonts and colors, and otherwise adjust according to your aesthetics to make a great template page for your slides.
Step 3: Export your slides into a shareable PDF.
When you're ready to report on progress, use the print dialog to generate a PDF with your up-to-date deck.
Track budgets across clients and focus areas
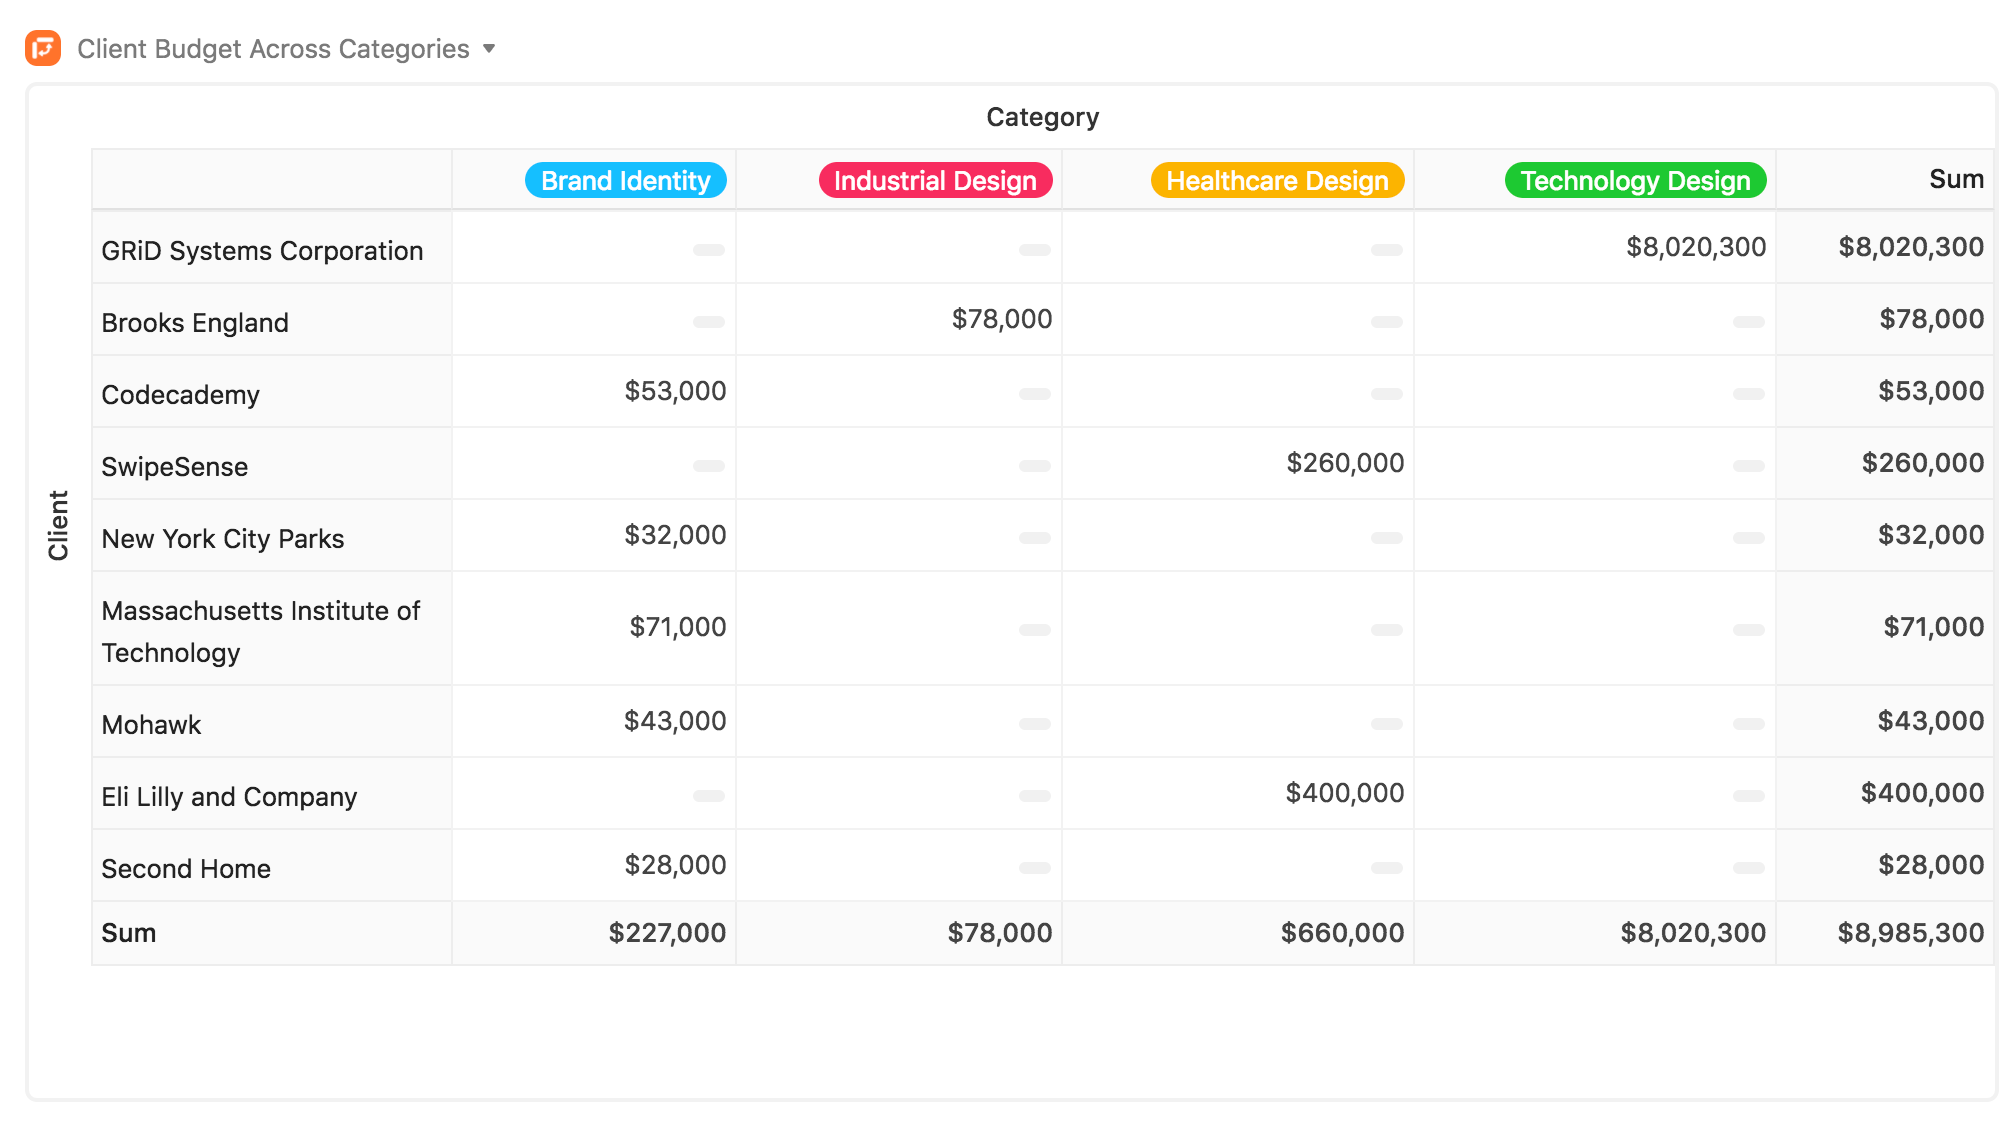
Use the pivot table app to sum up project data, like the spread of client budgets over relevant categories, at a high level.
Step 1: Make a budget field.
If you don't already have one, make sure that your project table has a currency field that lists the budget for each record.
Step 2: Add a pivot table app.
Open up the apps menu, click the add a app option, and add a pivot table app to your base. You can select your project table in the first settings field.
Step 3: Customize the table for your needs.
The view that you choose in the app settings will depend on which projects you'd like to analyze. If you're interested in breaking down all existing projects, you should select a master view; if you're interested in seeing budgets for only a subset of projects, like ones that are incomplete, you should select a view filtered down to just those records.
Above, projects are listed by client, and separated by category. To achieve this setup, select a field that show clients for your row grouping, and a field that indicates categories for your column grouping.
Keep tabs on virtual contributors and projects
Your project team needs to stay connected no matter where they're based. Host impromptu check-ins with a quick-access virtual meeting room—and keep key time zones in sight for referencing project deadlines.
Jump into e-meetings without leaving your base
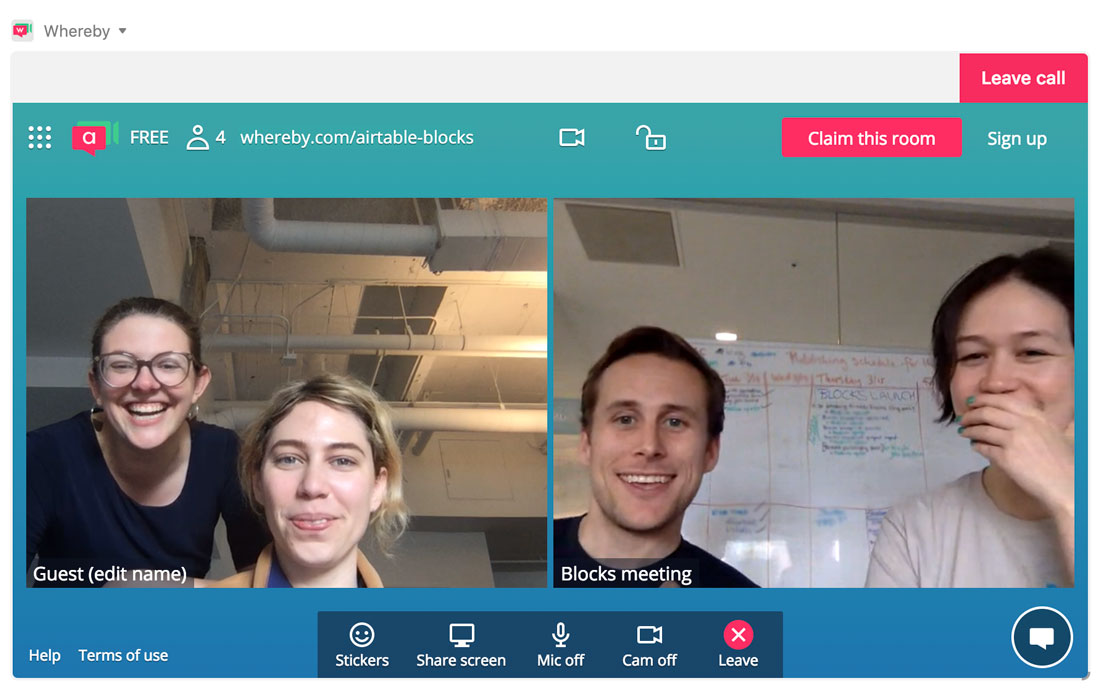
Use a Whereby or Google Hangouts app to give your team a place to quickly start virtual meetings that anyone in your base can join.
Step 1: Add a Whereby or Google Hangouts app.
Set up the meeting room of your choice by heading to the apps menu, clicking the add a app option, and choosing either the Whereby or Google Hangouts app.
Step 2: Share your meeting room address with external attendees.
Need to meet with a contributor who's not in your base? You can share your meeting room with outside stakeholders, and chat with them right inside your base.
For Whereby, you'll set a unique URL for your room that you can lock to uninvited guests. For Google Hangouts, you'll be prompted to login using your Google account, and can invite others directly from the room.
Make a dashboard of key time zones
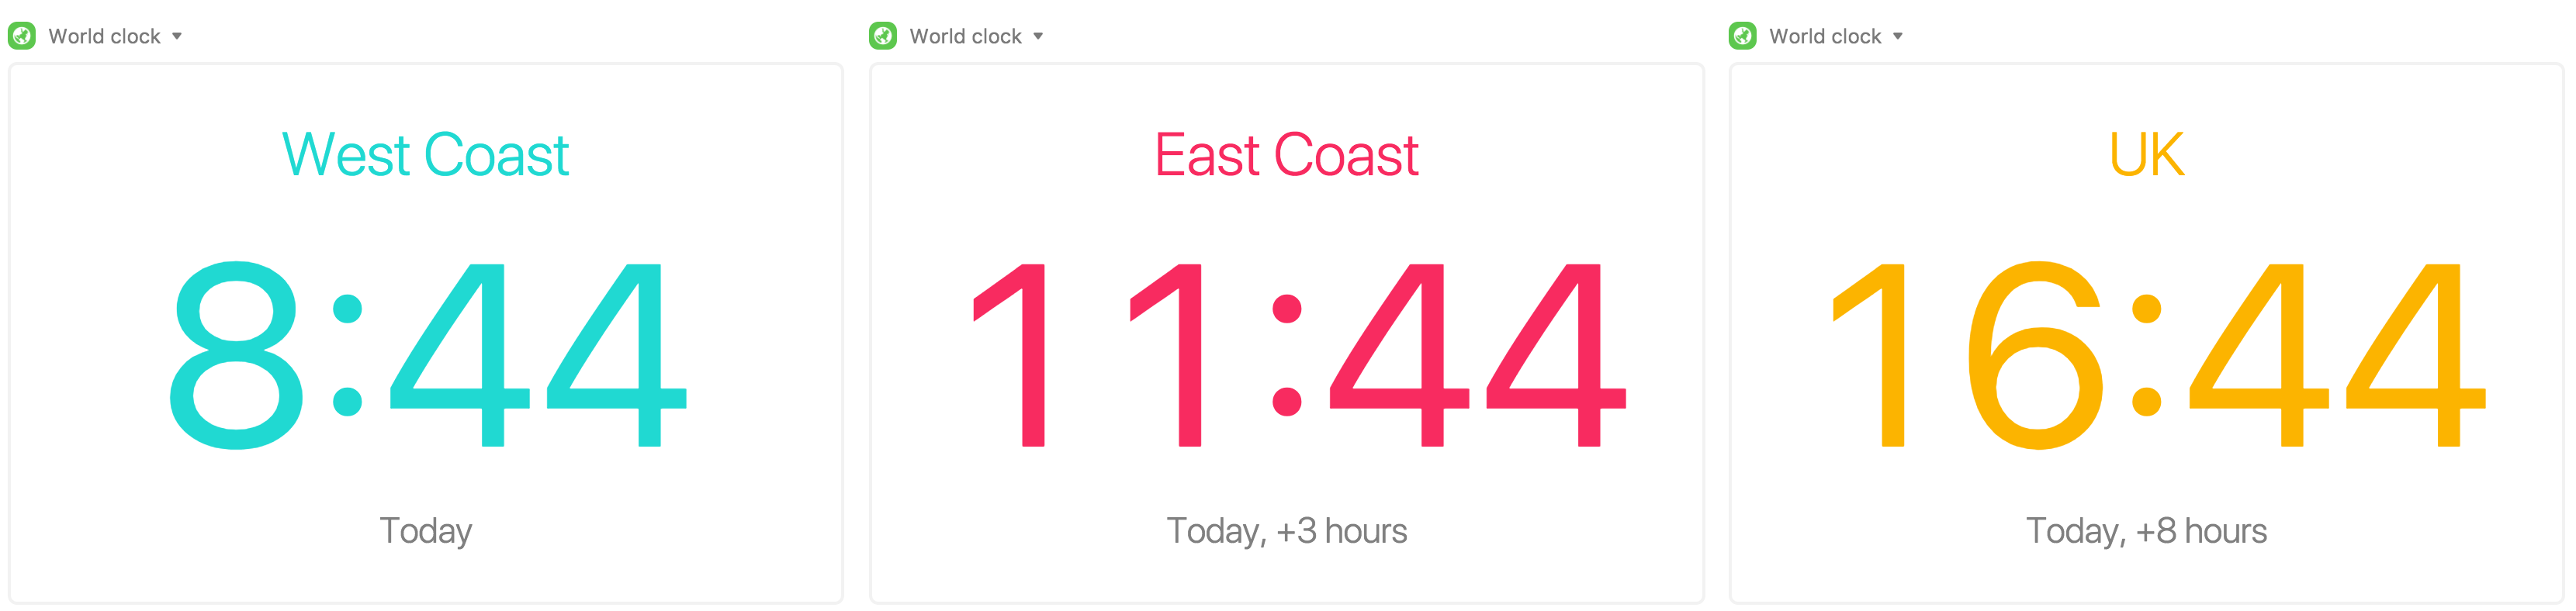
Add multiple world clock apps to display the local times in relevant time zones.
Step 1: Add a world clock app.
Choose the add an app option from the apps menu, then add a world clock app to your base and select the city whose time zone you'd like to display.
Step 2: Customize the clock's time zone and display options.
You can toggle between digital and analog modes, as well as 12- and 24-hour time formatting. You can change the color of the graphic and apply a custom label if you like.
Can't get enough of Airtable Apps? Sign up for our mailing list to get updated for each new app we launch!