As Arjun Sethi, a partner at Social Capital, writes in a Wired article:
Today there’s an endless stream of great content in the form of blog posts and ebooks about distribution, traction, growth, growth hacking, growth marketing and even growth teams. It’s easier than ever to learn because growth isn’t an art, it’s a science, and the methods are binary. You come up with hypotheses, you test them, you iterate and you prioritize based on learning what’s high impact for your product.
When you break it down, growth isn't just about finding wins. It's about building a repeatable process that helps you win over and over again.
We've put together a collection of our favorite templates that you can remix and reuse to create a tailor-made growth process for your company.
1. Basic growth experiments
The most important thing in growth is to be methodical. That means setting goals, making predictions, and analyzing results against your original baseline so you can iterate and improve.
In this basic growth experiment template, the main table gives you a bird's-eye view of all growth experiments in the pipeline:
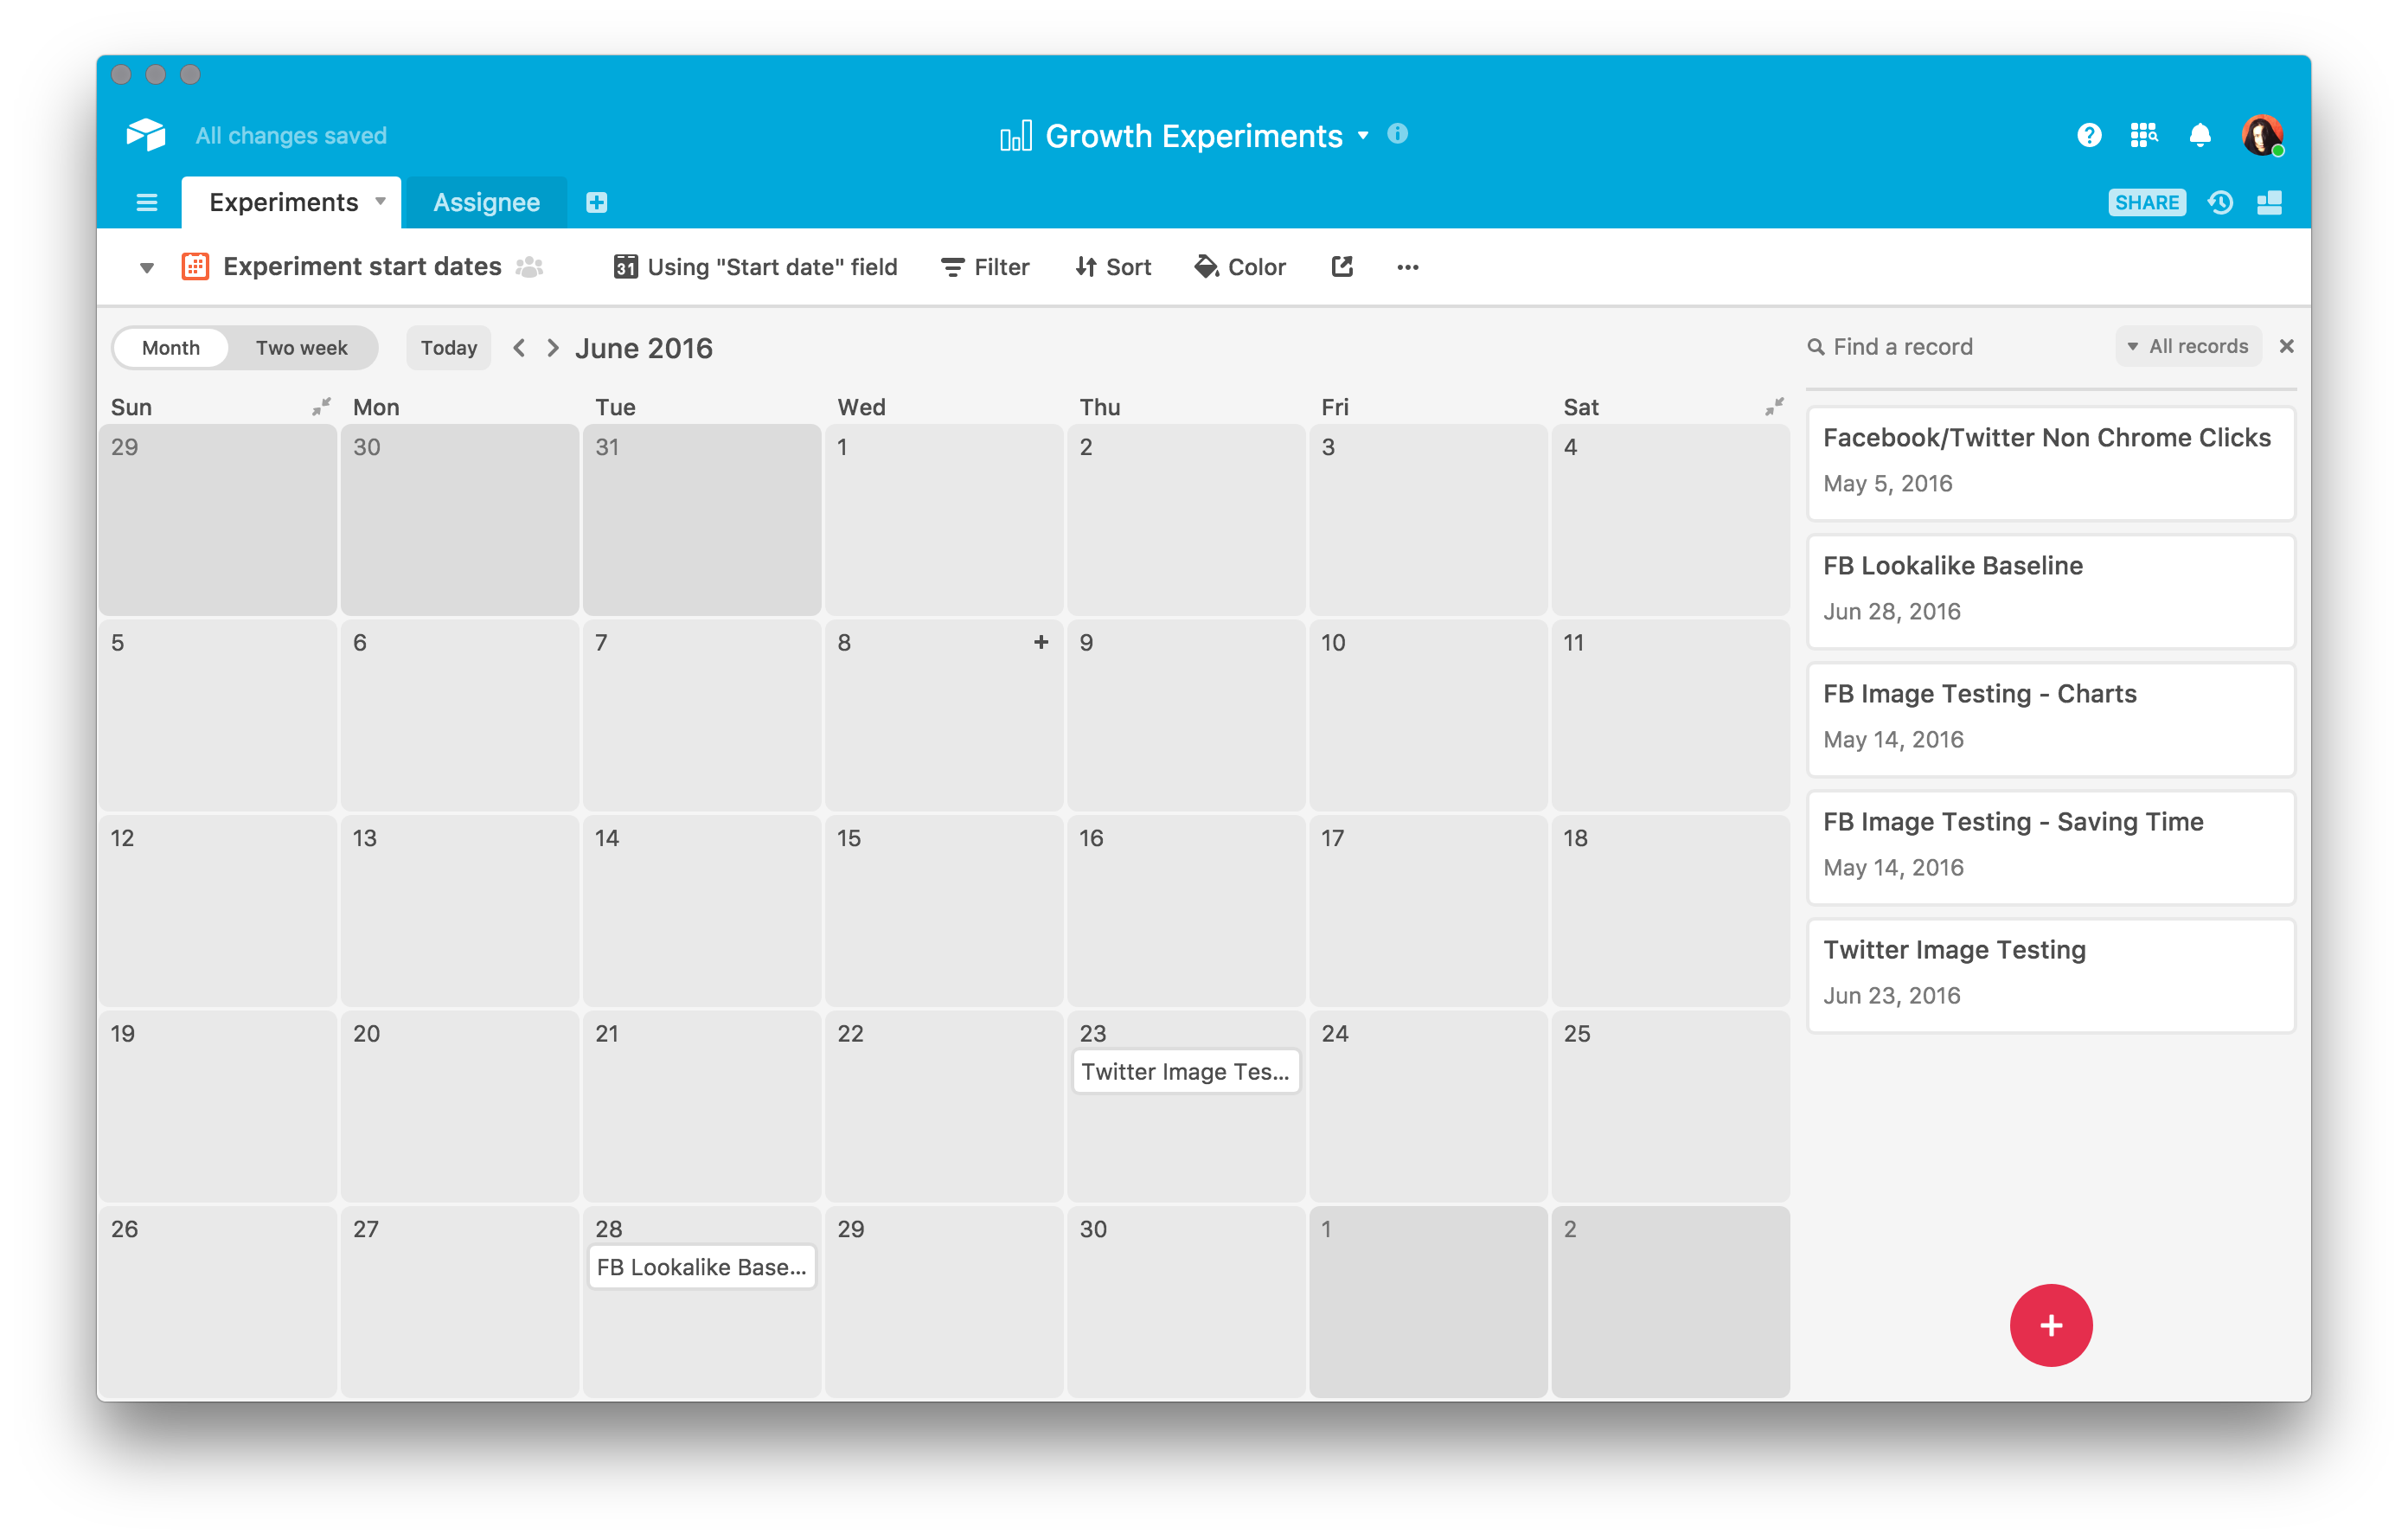
Flip to the calendar view, and you can see your experiments by their start date:
Finally, another view groups experiments according to outcome, making it easy for you to track the results of all your experiments in a single place:
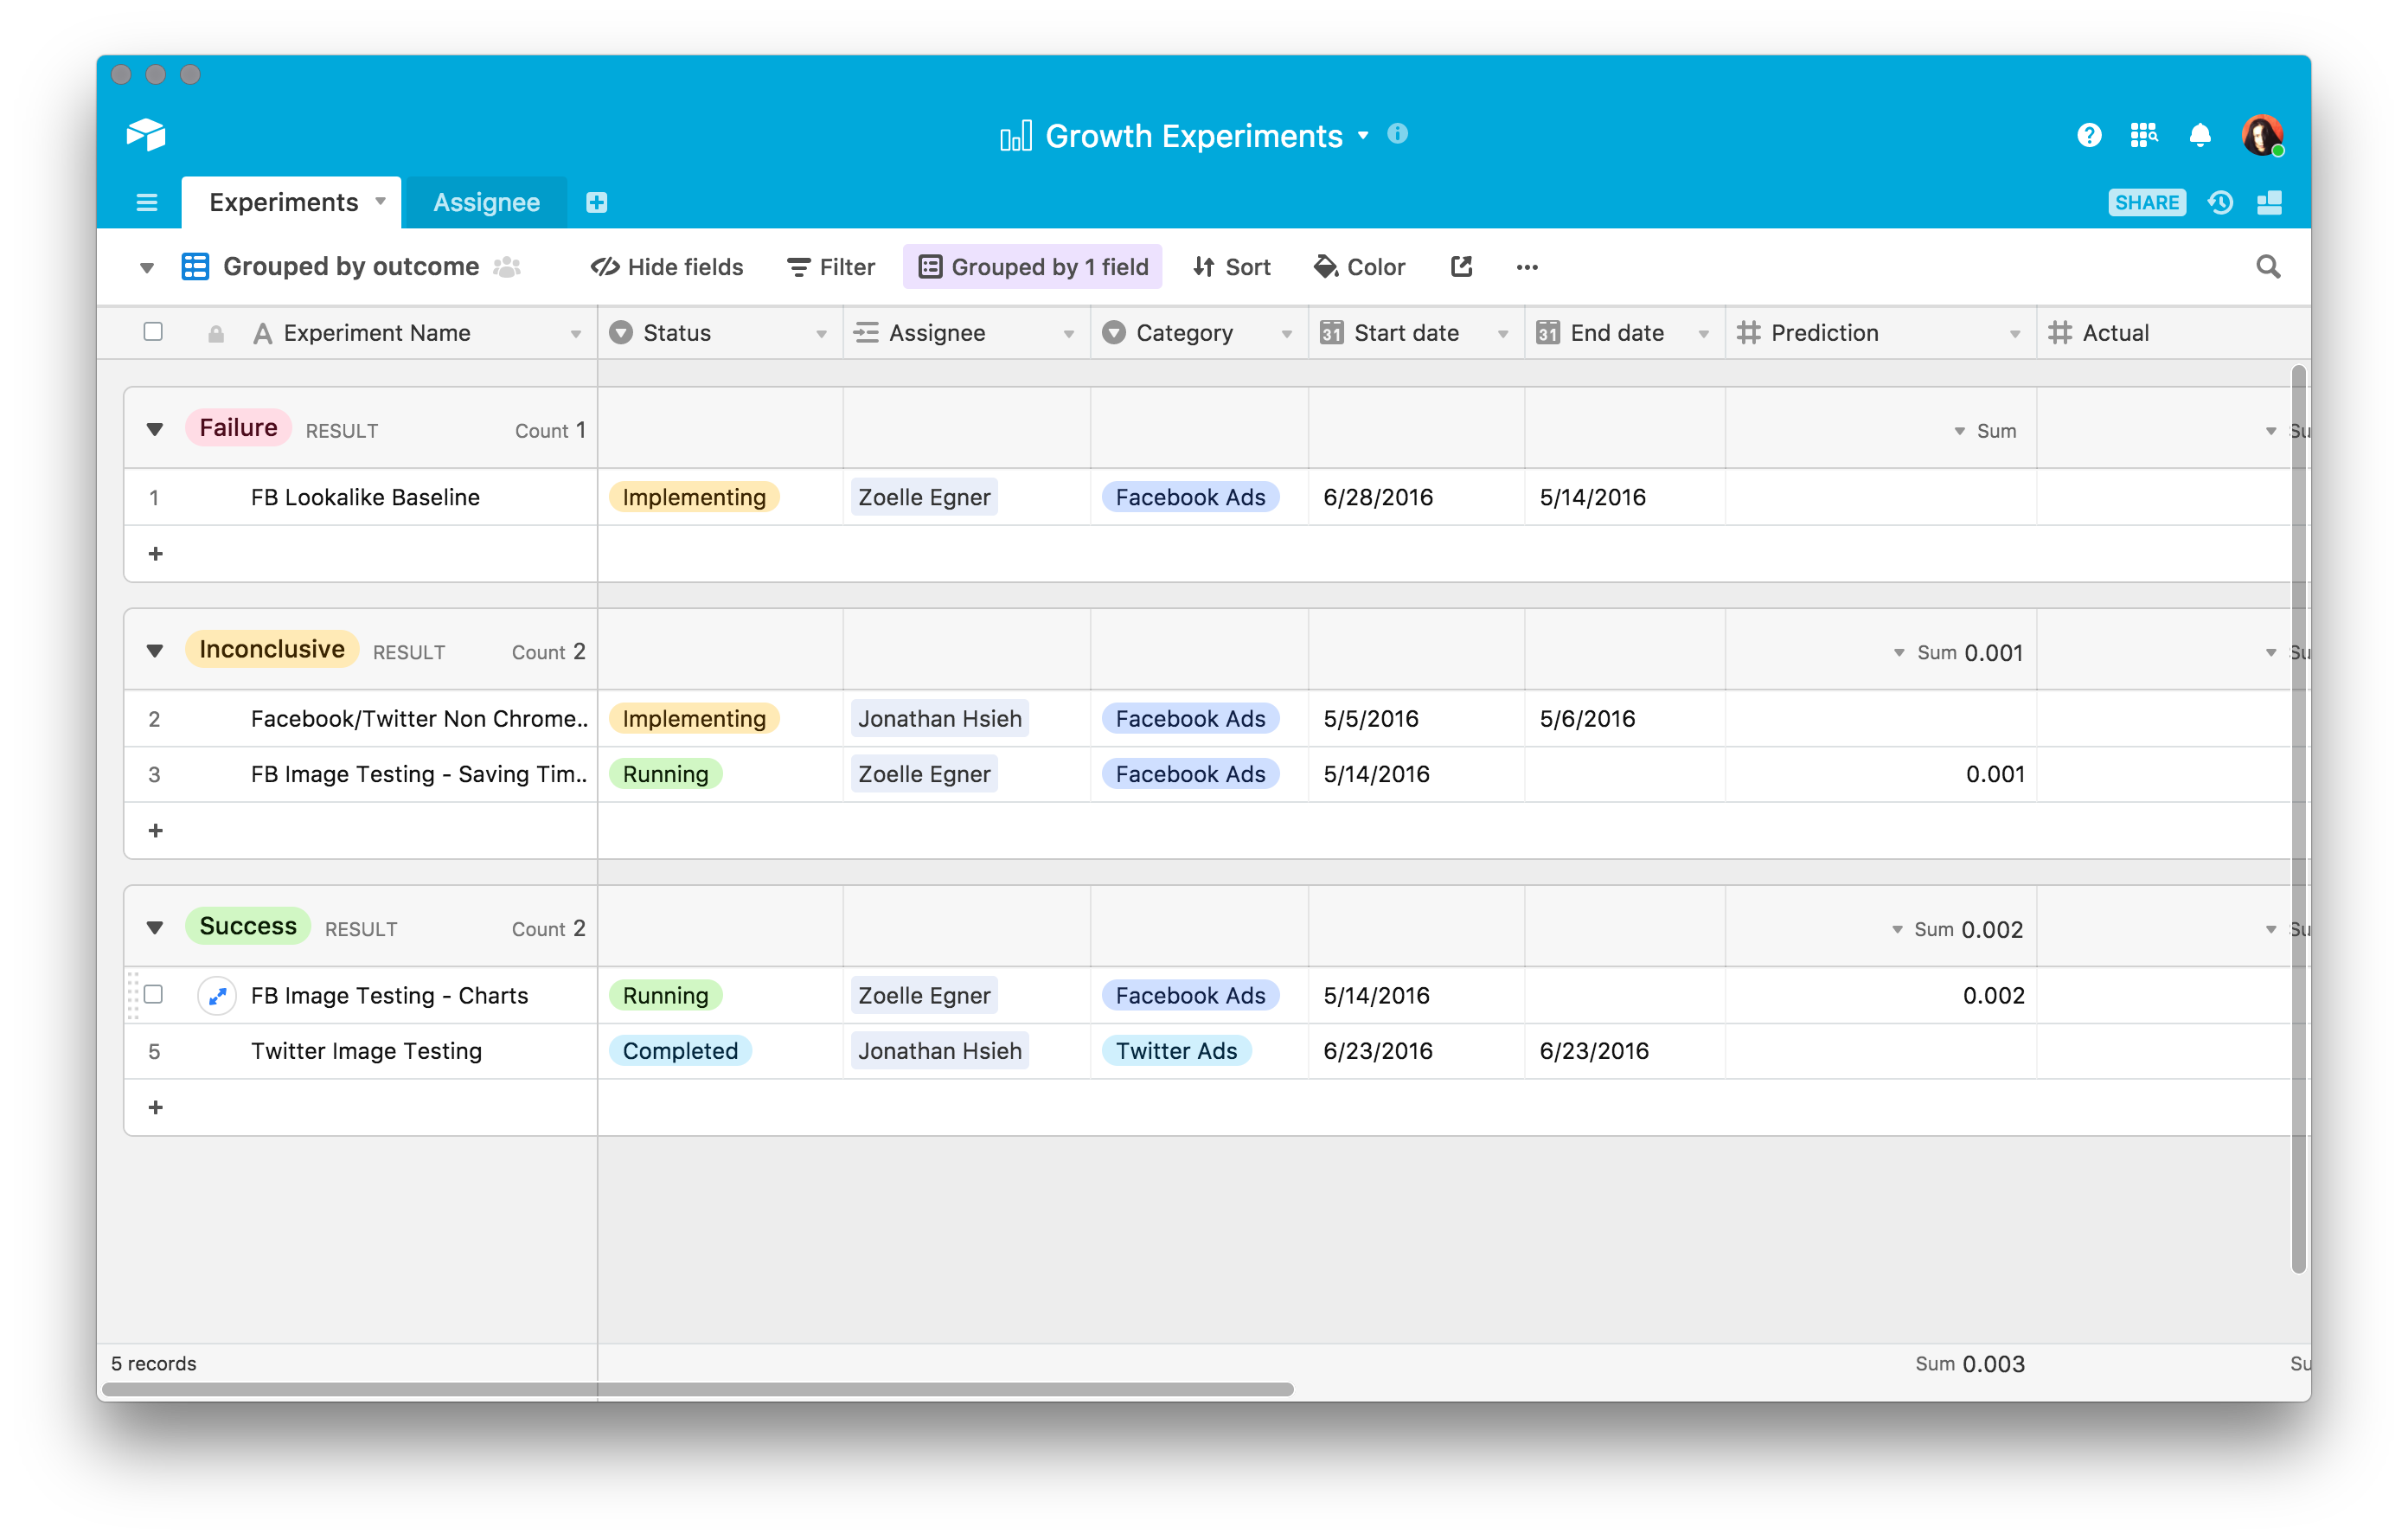
The ultimate goal early on is to set up something simple and basic that everyone in a company can use to track the experiment pipeline.
2. Growth experiments planning and execution
As you expand your growth operation, it isn't always enough just to be able to plan and track all your experiments in a single place. Experiments get complicated, with different tools and different executions. At this stage, it's crucial to connect the dots between experimentation planning, execution, and communicating the results with your team.
The following template helps you manage each of these critical junctures in the growth process, whether it's brainstorming ideas, implementing them, or analyzing the impact on your funnel.
In the following view, experiments are grouped according to their status in the pipeline, from requiring design, to scheduling, to completion and analysis.
A simple brainstorming form allows anyone on the team to directly input experiment ideas, and categorize them with the appropriate metadata:
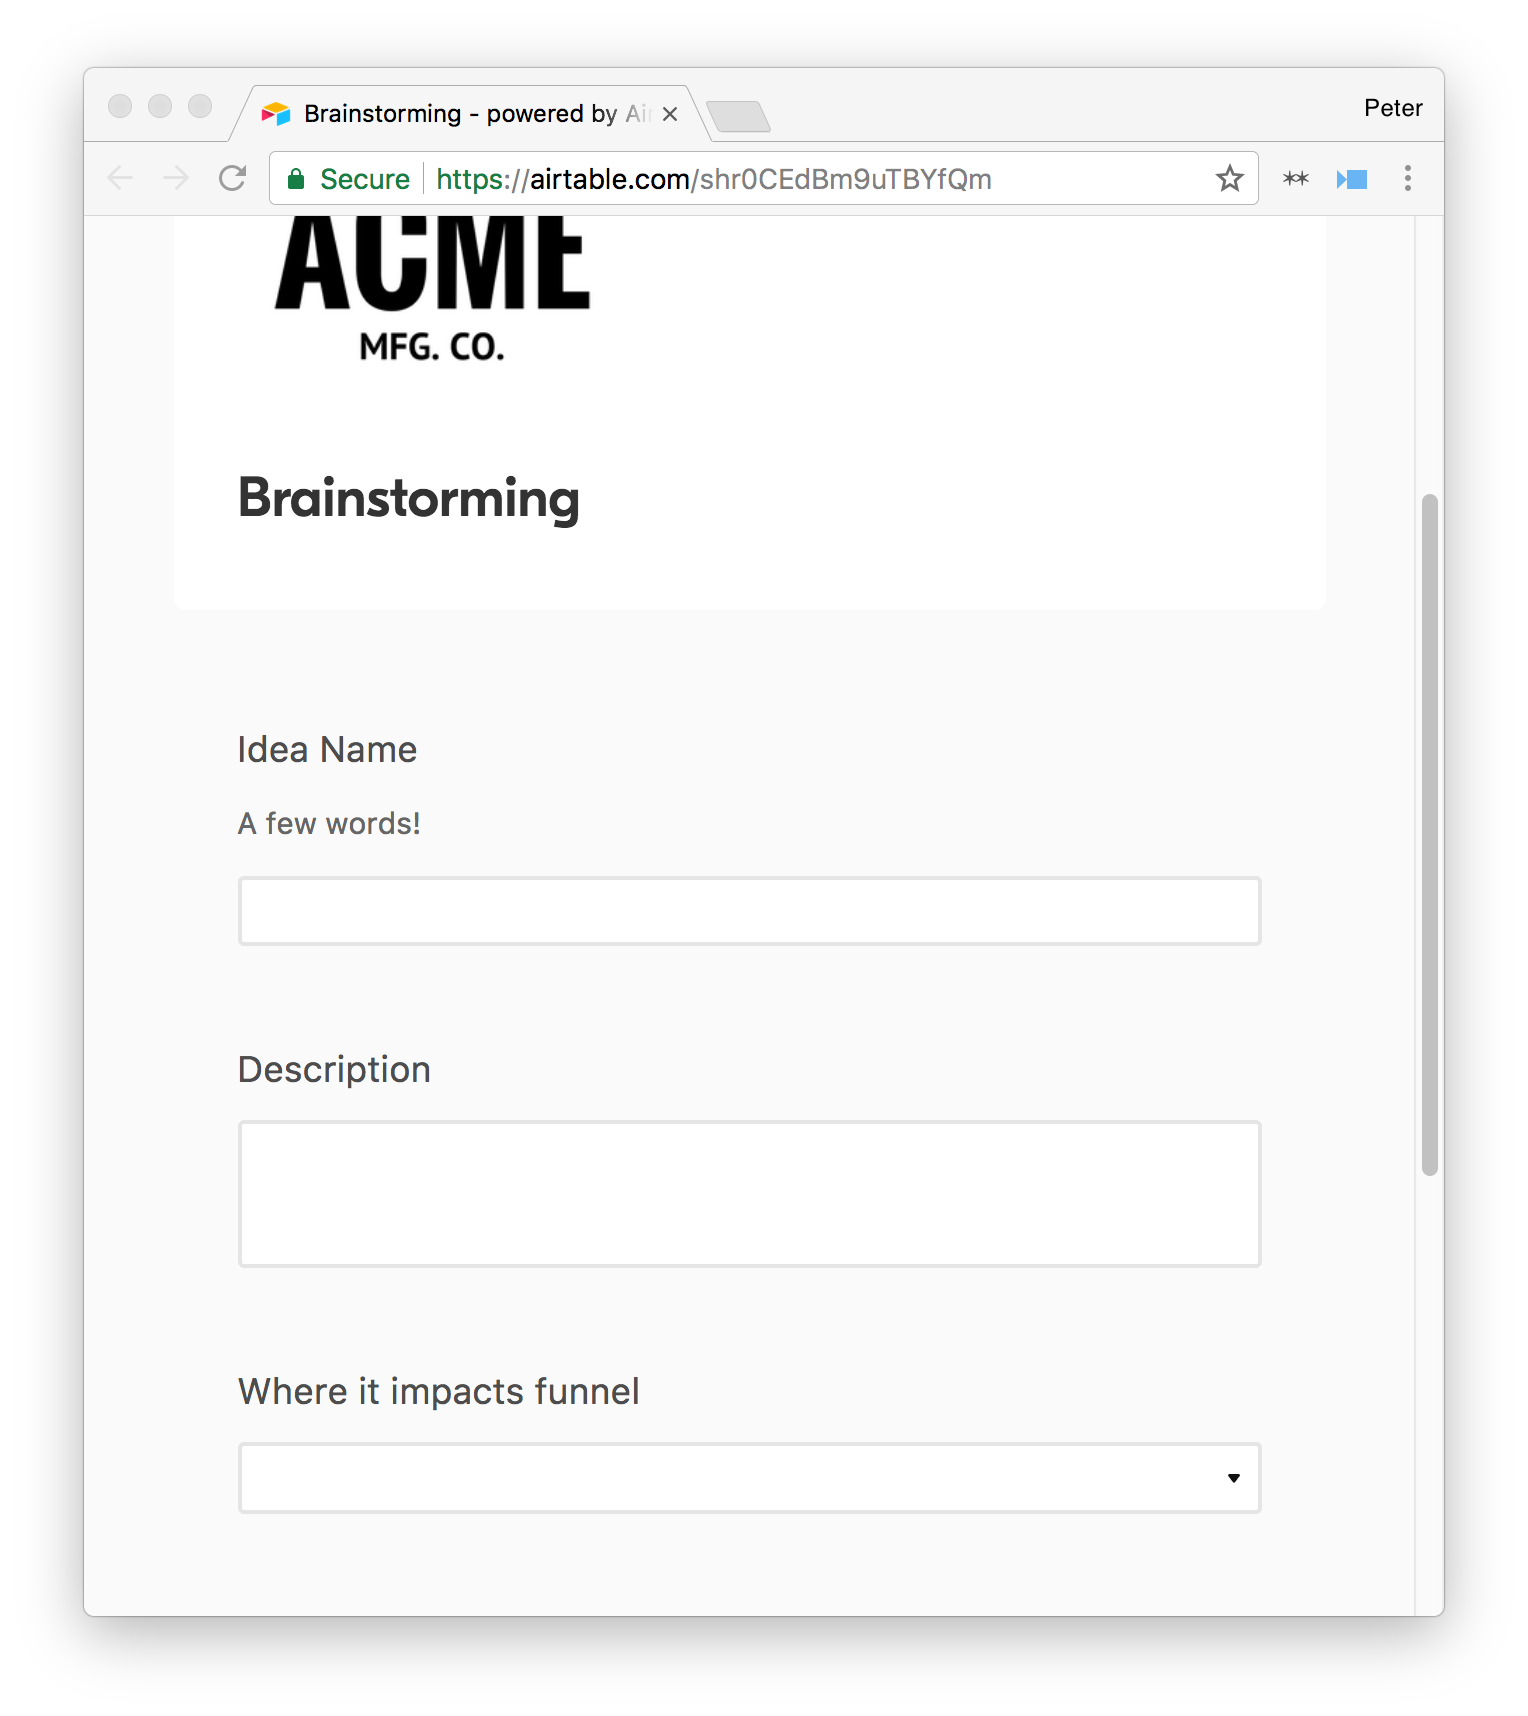
When you're experimenting to get more growth, you're often trying to move the needle at a very specific point in the customer journey. That might mean increasing sign-ups through marketing campaigns, or testing your onboarding flow to improve user retention. Categorizing experiments along criteria such as where they impact the funnel, how they're being implemented, and the target outcomes provide you with a more granular view of the data.
For example, if we wanted to look at experiment results according to measurable outcomes, we can simply create a view that groups records according to their funnel impact:
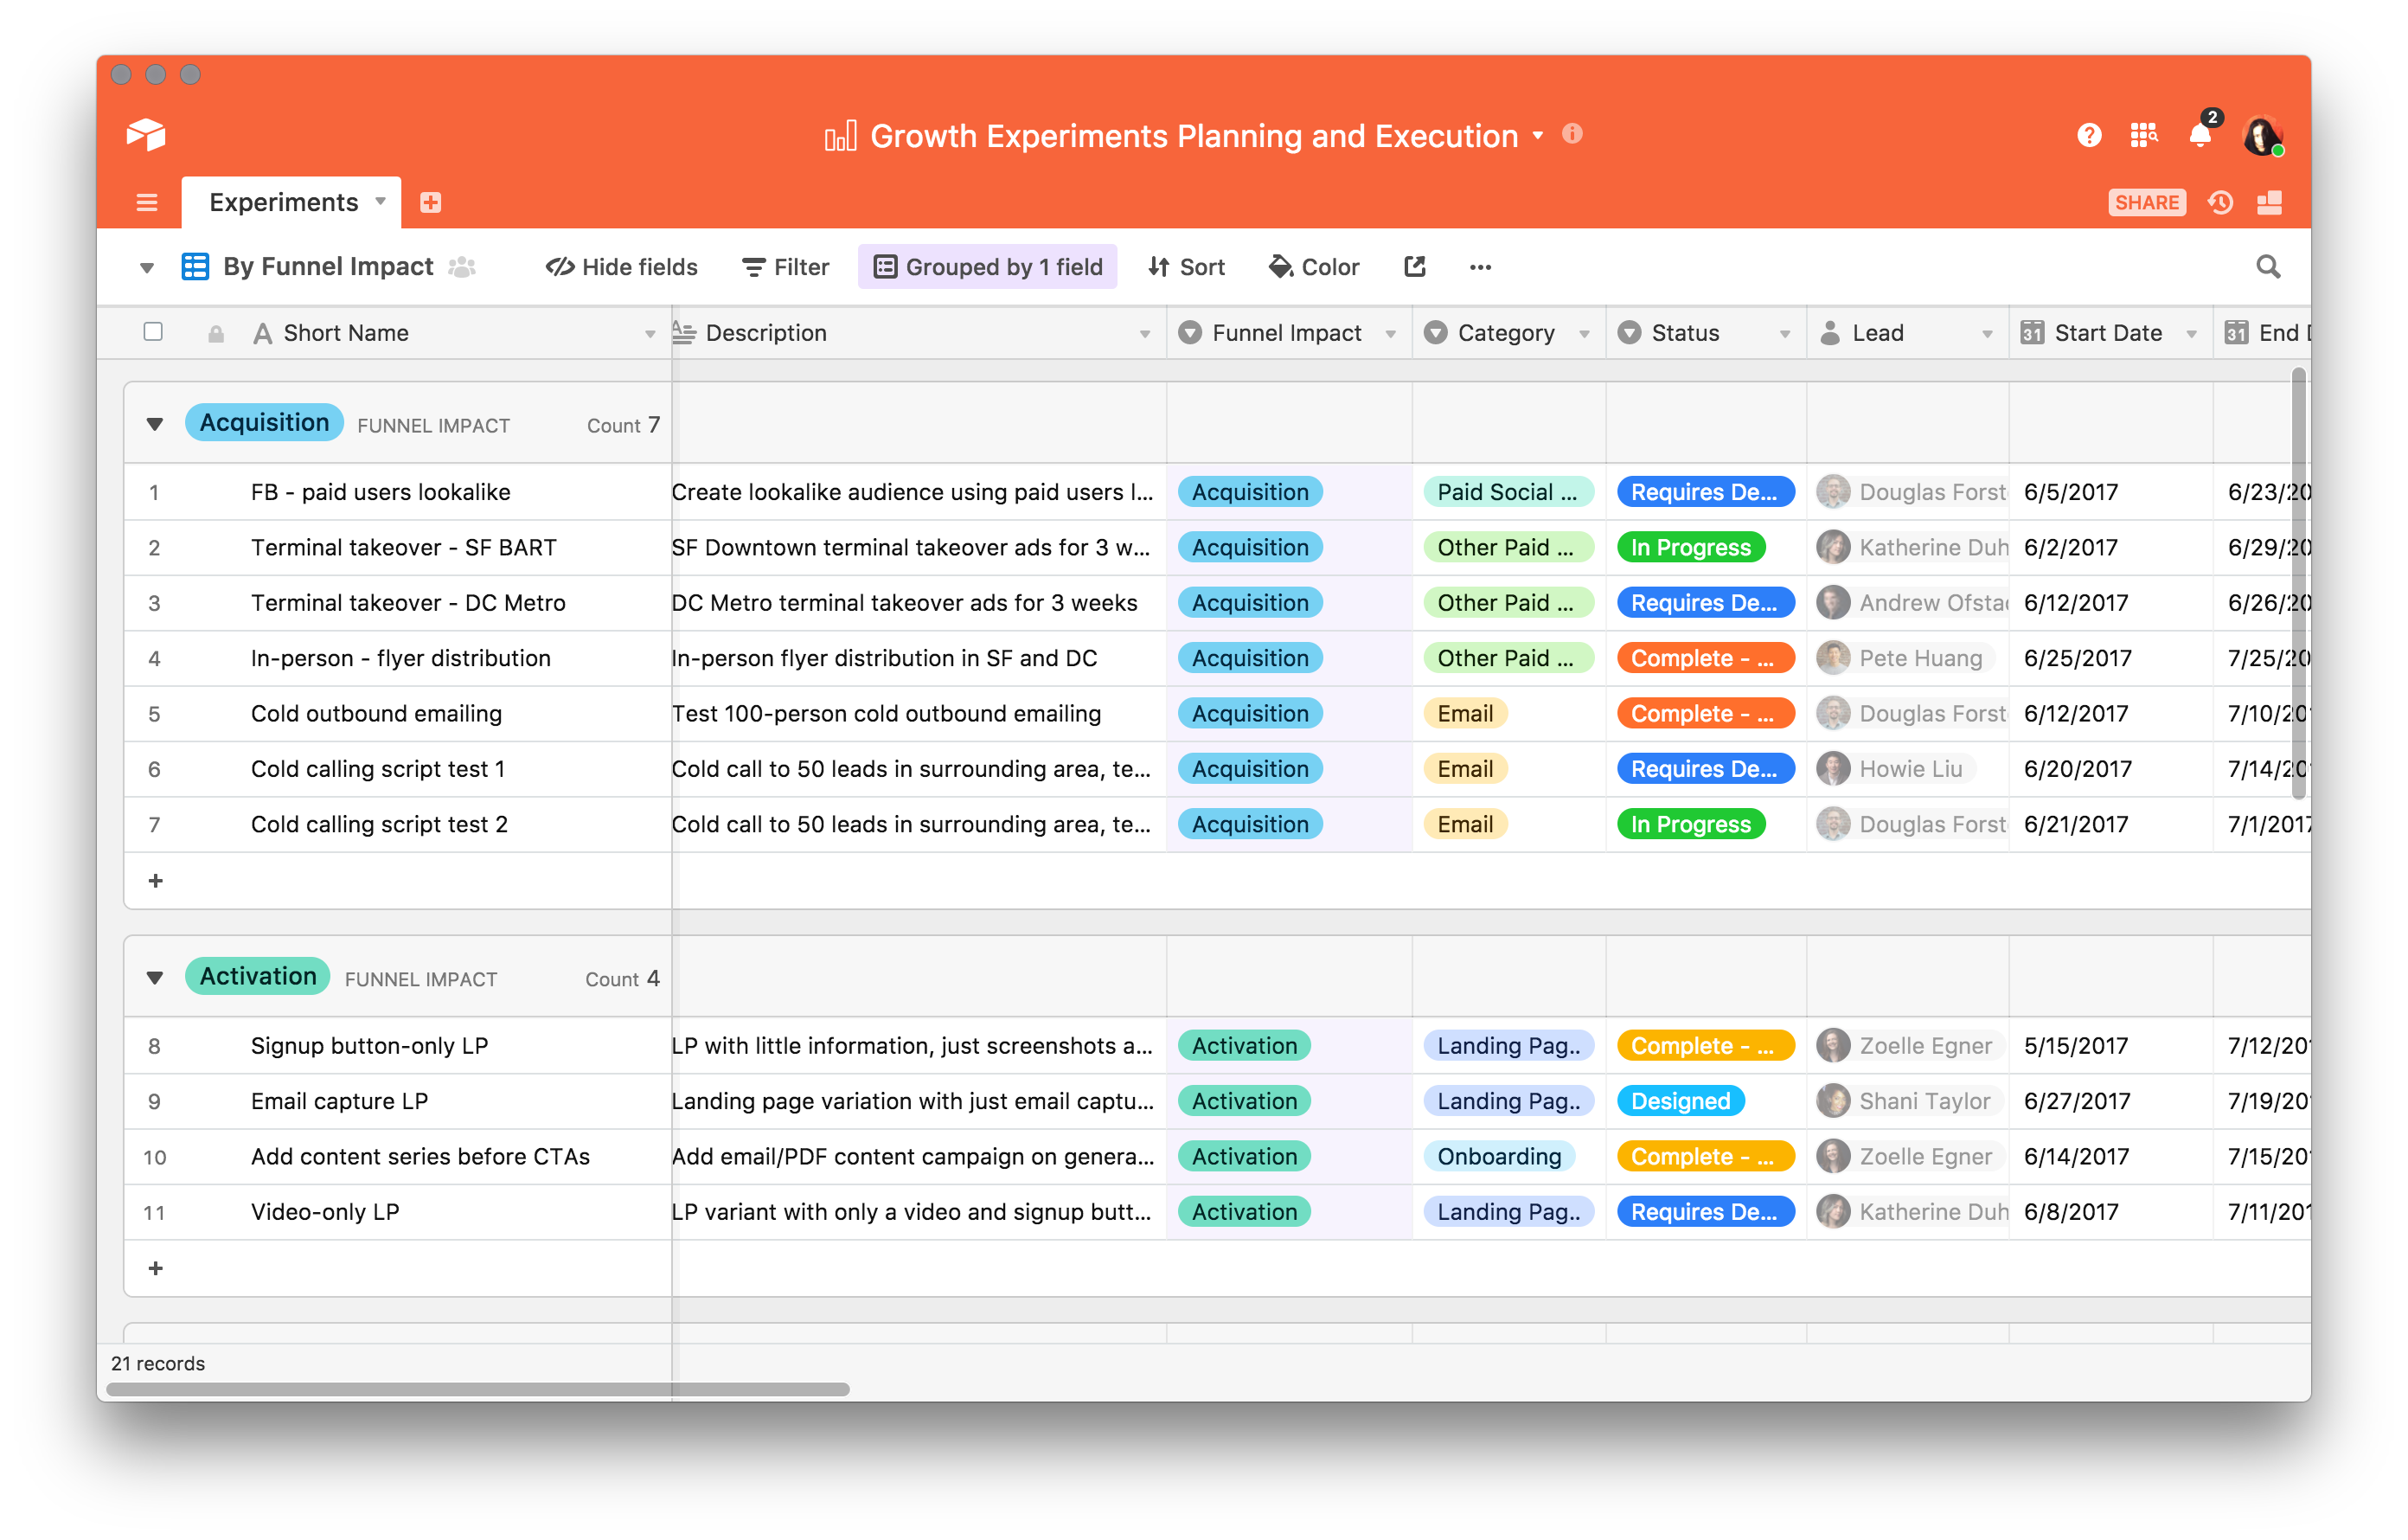
In a glance, you can see which experiments have impacted everything from acquisition to retention.
Running a growth team is heavily variable according to the kind of product you're trying to drive growth for. A good starting point is to build a flexible process that allows you to slice and dice your data according to the criteria you need.
3. Scale a culture of experimentation
When you're initially putting together a growth team, your objective is to find areas in which you can drive growth for your product. As you scale the company, the challenge becomes slightly different: how can you enable different teams to run experiments, iterate, and grow? That's the only way you can scale growth repeatably.
Andrea Burbank, a data scientist at Pinterest, recommends: “The problem you want to solve is scaling yourself—figuring out what you're doing that's helping these experiments be successful. Develop repeatable processes and guidelines and checklists so that you don't have to be that single point of failure.”
We put together this experiment checklist based on one of Andrea's slide decks.
Forcing someone on the marketing or product team to run ideas by the growth team each time they want to set up an experiment puts an unnecessary bottleneck on the process and makes it difficult to continually experiment. At the same time, experiments need to follow a method. Otherwise you run the risk of getting faulty data. Setting up this type of checklist for your company helps scale experimentation across the company—beyond just the growth team.
4. Growth OKRs
Brian Balfour, former VP of Growth at HubSpot, recommends that growth teams set OKRs—Objectives and Key Results—to track growth goals.
- Write down your goal
- Set a time period (30-90 days)
- Assign three key results, or measurable objectives that you can track, i.e., OKR1: Improve activation by 50 percent; OKR2: Improve activation by 2x;
OKR3: Improve activation by 10x.
The key is to map out key results by their probability of success. In the above example, your team might have a 90 percent chance of achieving the first key result, a 50 percent chance of achieving the second, and a 10 percent chance of achieving the third result. This helps keep your growth goals realistic while leaving room in the margins to achieve stretch goals.
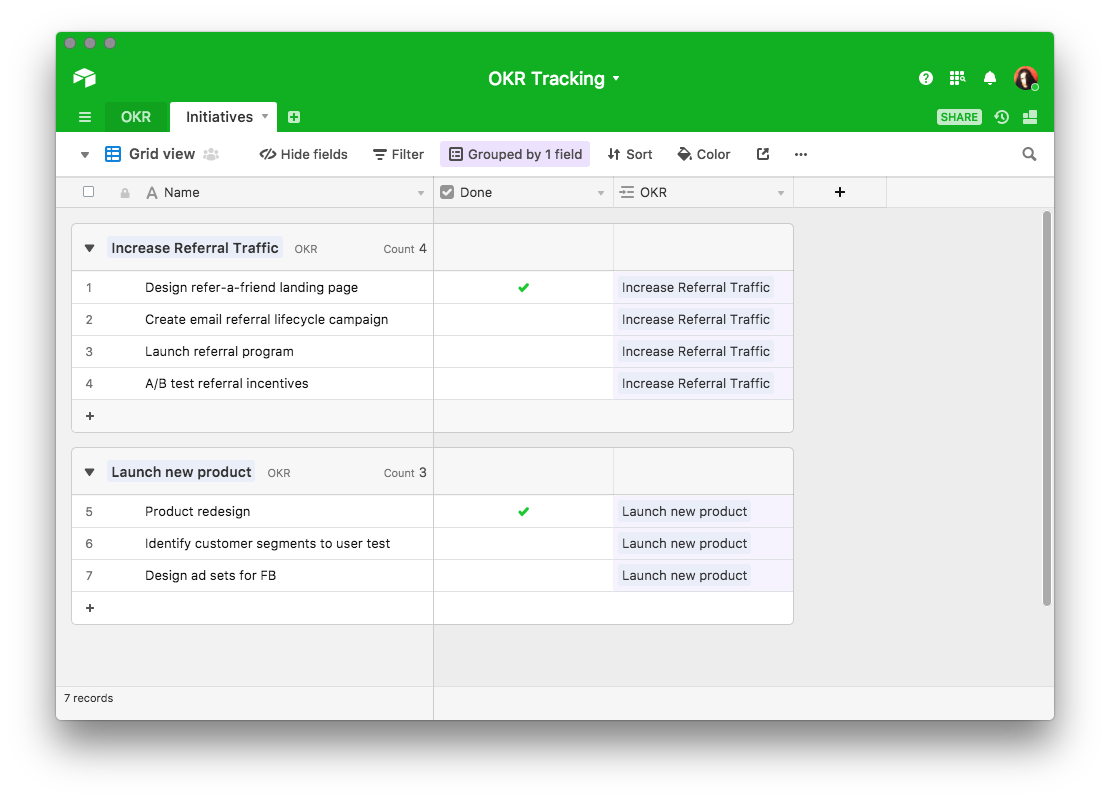
Here's a basic template you might use to track your growth team's OKRs:
The main table works as a dashboard that you can use to keep track of everyone's OKRs on your team. You can see what quarter it's scheduled for, each key result, and whether it's a team or individual OKR.
This dashboard is linked to another table named “Initiatives”, which works as a checklist for what steps are being taken to achieve each OKR:
In a single base, your team has access to high-level, long-term goals, and can dig in more granularly as needed.
5. User surveys template
To get more growth, the first step is often to get inside the heads of your users and figure out what makes them tick. As Y-Combinator co-founder Paul Graham writes, “startups early on need frequent feedback from their users to tweak what they're doing.” The challenge is getting that feedback at a steady cadence and high frequency.
The following template is a base for managing user surveys and NPS scores. The primary table shows a list of all survey responses for Porchcam, a fictional smart camera product.
The table above shows basic user information for each response, and contains both multiple-choice survey responses as well as text fields for longer-form answers as well as notes.
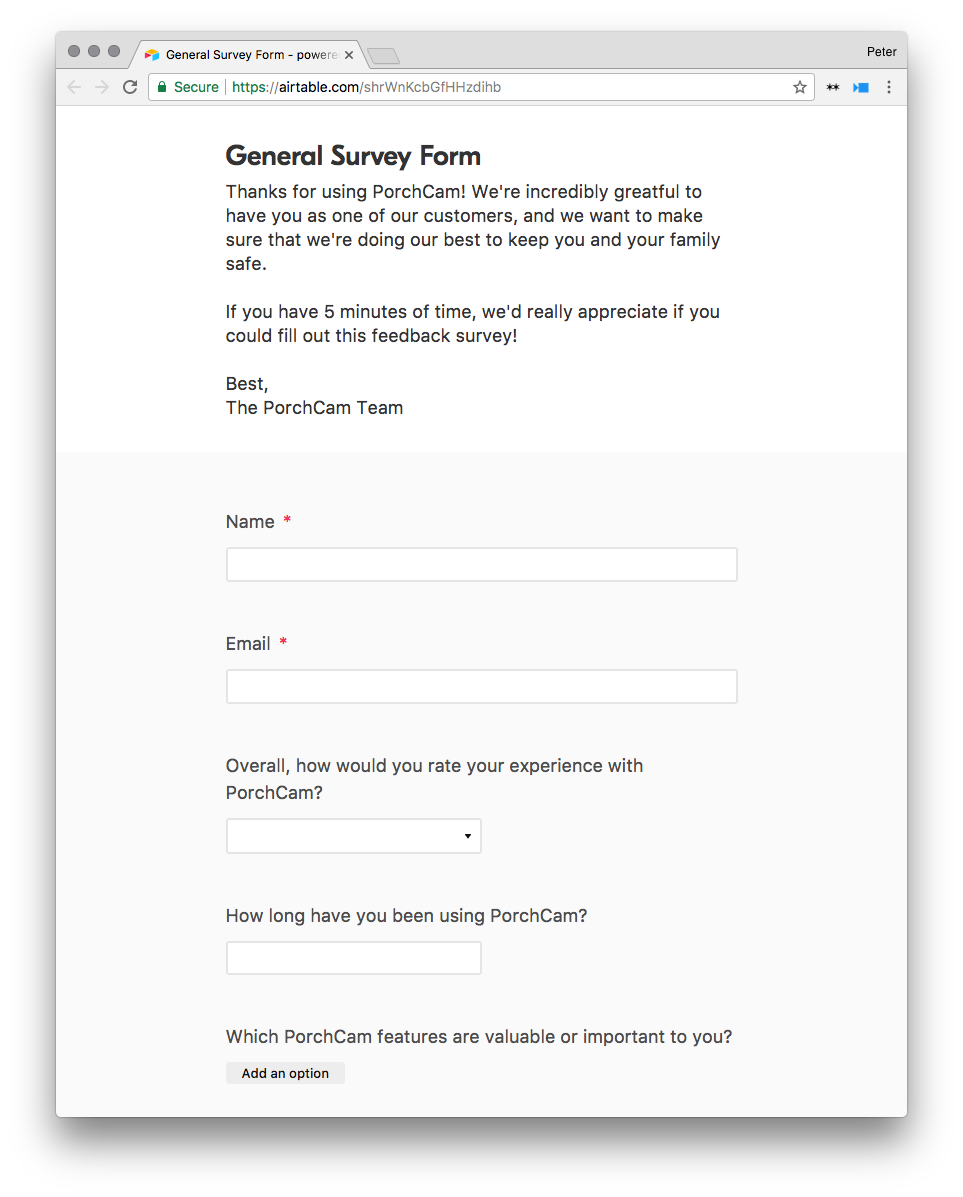
Survey responses can be gathered through this form:
The base also contains a table specifically for NPS surveys:
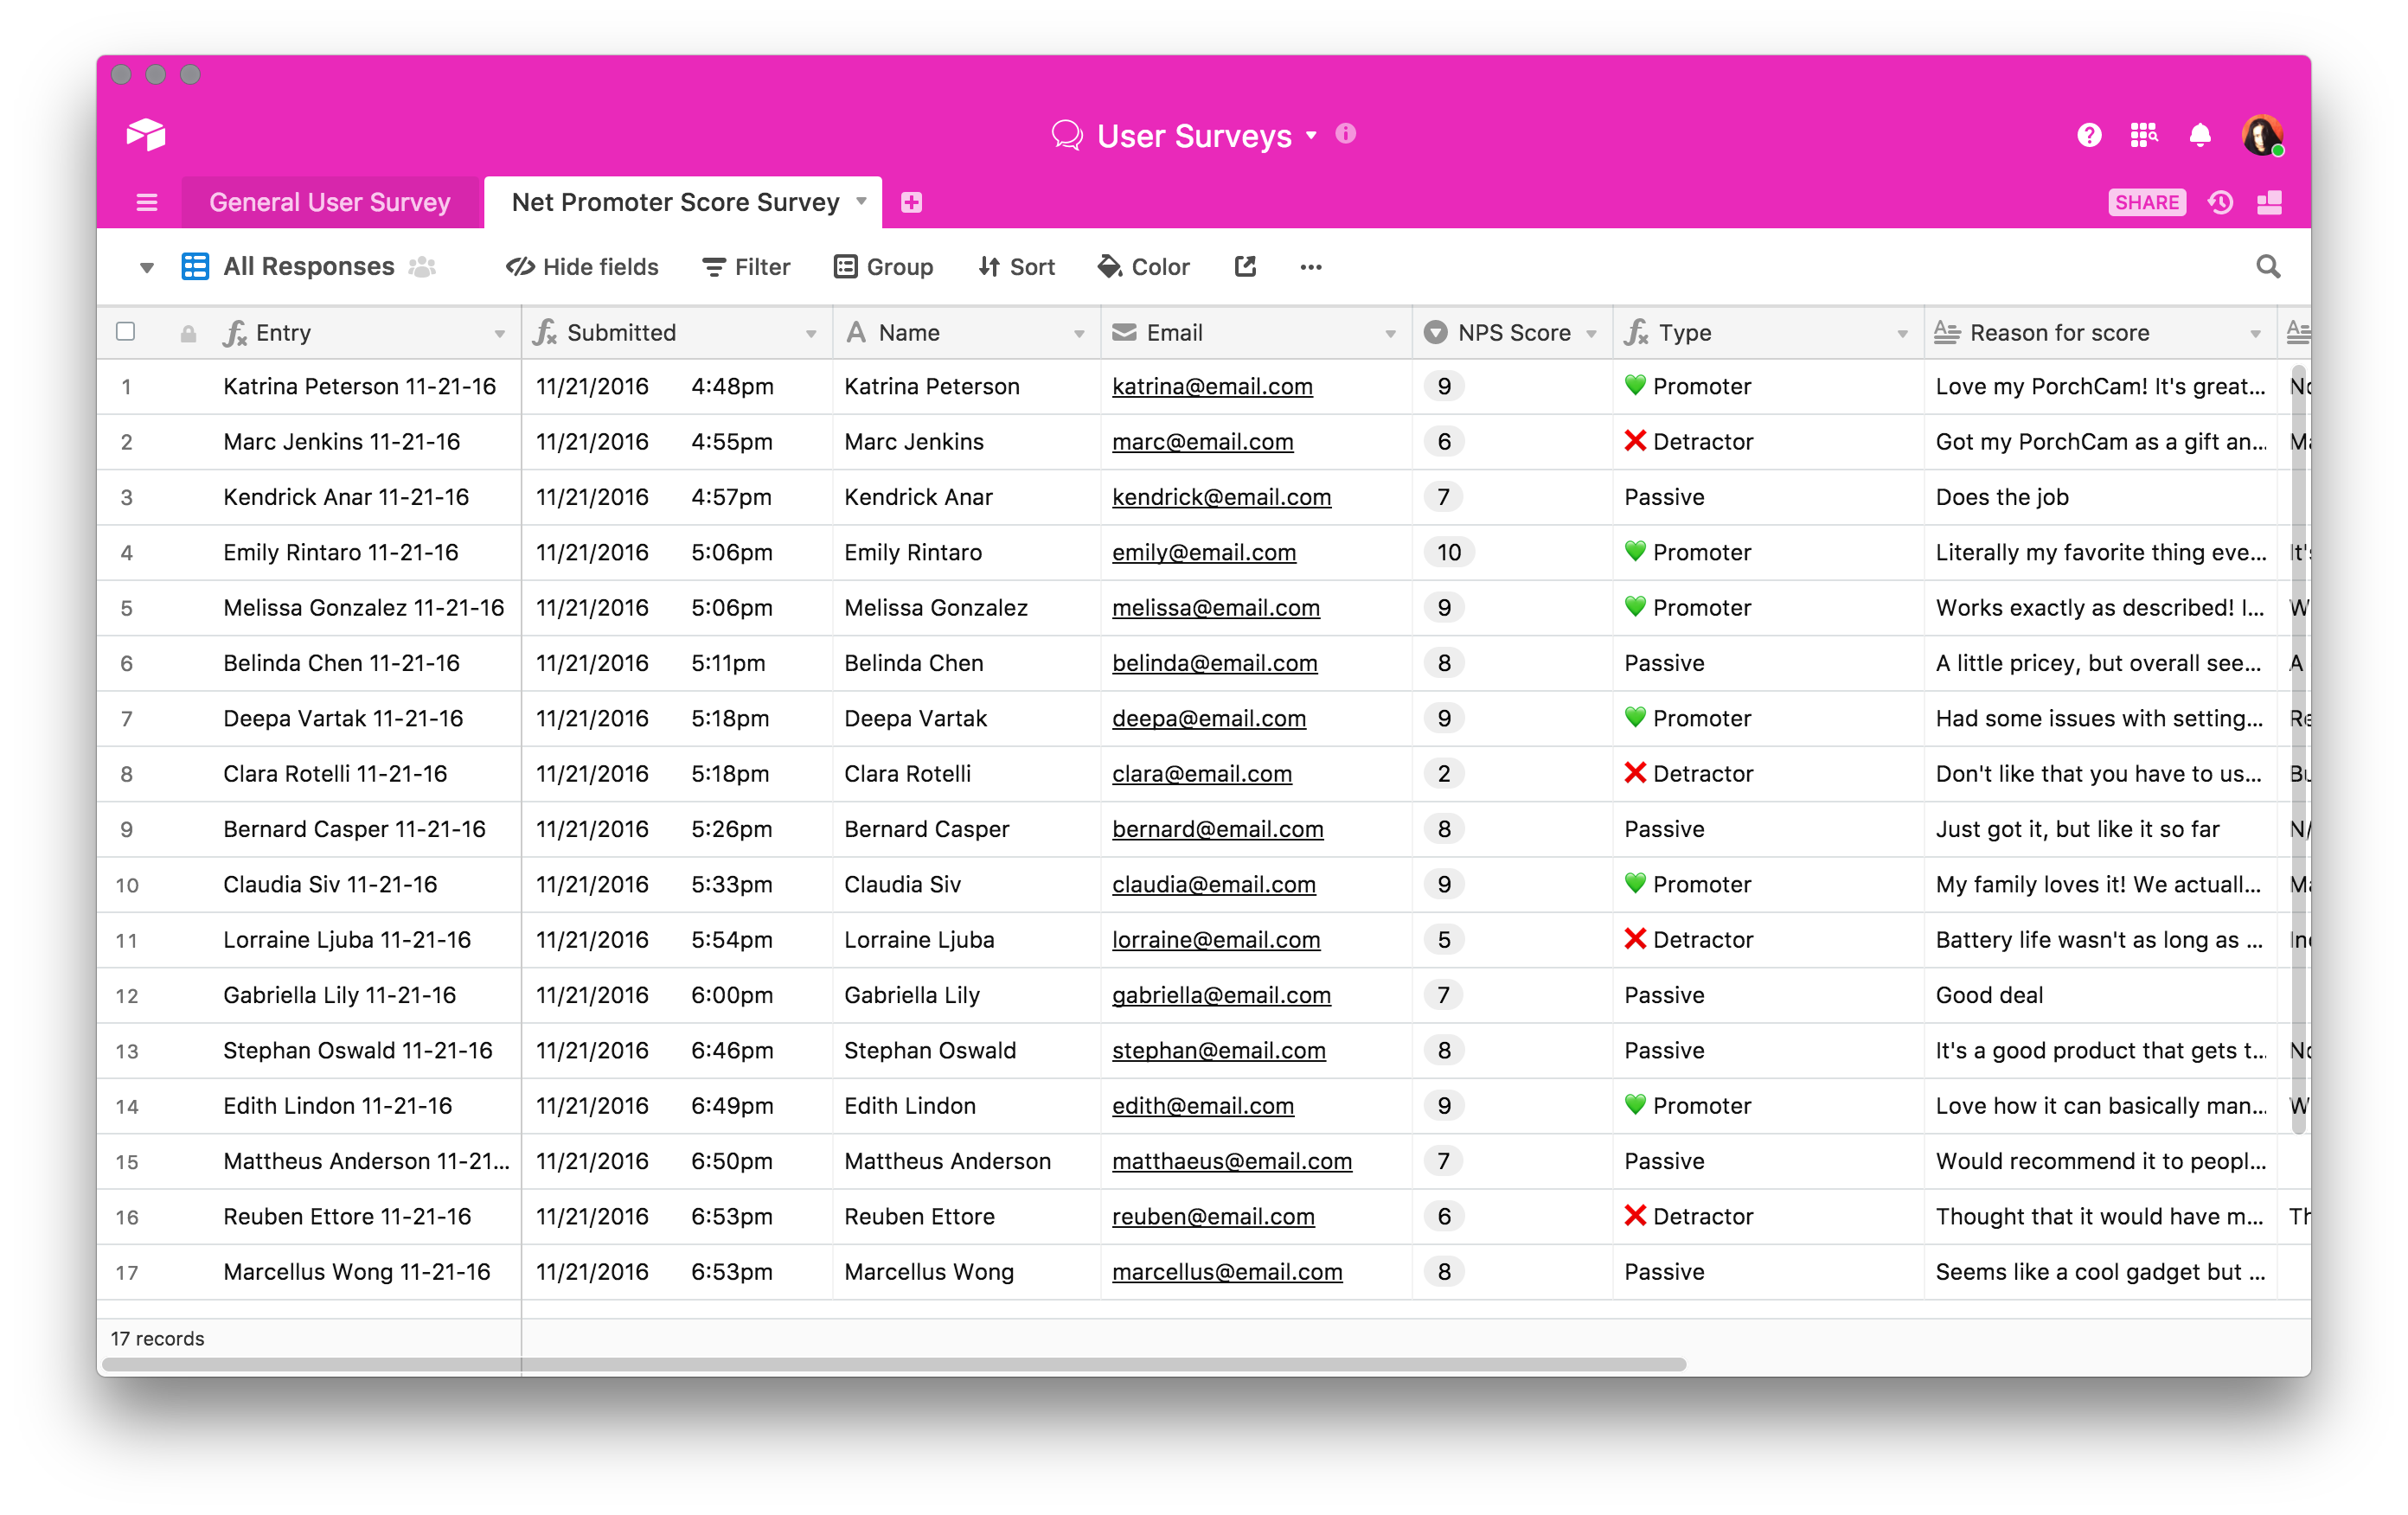
An NPS survey basically consists of two parts. The first part asks a user how likely they'd recommend a product to a colleague on a field of 1-10. The second part simply asks them why. NPS is a useful, quick way to collect quantitative and qualitative feedback on your users.
Building blocks for growth
Growing something from nothing is hard precisely because the possibilities can feel limitless. Early on, when you're trying to grow an initial product you're often starting from scratch with everything you do—whether that's running Facebook ads or optimizing your onboarding flow. What allows you to scale this process is filling in the white space and building a foundation that you can turn into repeatable processes. These templates are meant to work as building blocks to do exactly that.